11.2 Solvents Recovery Service of New England, Inc., Superfund Site, Southington, Connecticut
Key Concepts
- Connection between technical questions, data needs and collection methods
- Economical measurement of average hydraulic apertures of fractures
- Drilling with dye to improve screening-level groundwater sample quality
- Horizontal anisotropy assessment in dipping fracture system
- Deep DNAPL zone delineation in bedrock
- Evaluating fracture apertures versus depth
- Use of groundwater flow and solute-transport modeling (with matrix diffusion) to select monitoring well locations, interpret the bedrock NAPL-zone and VOC plume extent, and confirm no completed exposure pathway
Contacts
Michael J. Gefell
Anchor QEA
(303) 984-6250
[email protected]
Bernard H. Kueper
Queen’s University
(613) 533-6834
[email protected]
Bruce R. Thompson
de maximis, inc.
(860) 298-0541
[email protected]
Key Concepts
- Connection between technical questions, data needs and collection methods
- Economical measurement of average hydraulic apertures of fractures
- Drilling with dye to improve screening-level groundwater sample quality
- Horizontal anisotropy assessment in dipping fracture system
- Deep DNAPL zone delineation in bedrock
- Evaluating fracture apertures versus depth
- Use of groundwater flow and solute-transport modeling (with matrix diffusion) to select monitoring well locations, interpret the bedrock NAPL-zone and VOC plume extent, and confirm no completed exposure pathway
Site Description
The Solvents Recovery Service of New England, Inc., (SRSNE) Superfund Site is in Southington, Connecticut, approximately 15 miles southwest of the city of Hartford (United States Environmental Protection Agency [USEPA] Region 1). SRSNE processed more than 100 million gallons of solvents, fuels, paints, and other organic liquids between 1955 and 1991. Still bottom discharges to lagoons and other releases produced a nonaqueous phase liquid (NAPL) source zone and associated aqueous-phase plumes in overburden and fractured bedrock. The plumes of volatile organic compounds (VOCs) above drinking-water standards have been hydraulically controlled by pump and treat since 1998. The site has been intensively studied for the past 35 years.
Physical Setting
The site is in the Quinnipiac River Valley, which is part of the Connecticut Valley Lowland that occupies a regional, structural rift basin with tilted bedrock strata (Figure 11-4). The area is characterized by relatively broad river valleys separated by low north-northeast trending bedrock ridges. The former SRSNE Operations Area is at the base of the eastward sloping hill. The adjacent properties to the east and southeast are in the flat, central part of the river valley. The Quinnipiac River flows south through the study area.
Overburden Geology. The overburden includes Pleistocene glacial outwash and a thin, discontinuous layer of till at the bedrock surface, with isolated deposits of fill and post-glacial alluvium. The overburden thickness varies throughout the study area, from approximately 15 to 30 fft at the SRSNE Operations Area, 50 ft at the Quinnipiac River, and up to 200 ft east of Queen Street. The overburden gradually coarsens and its hydraulic conductivity increases southward within the river valley from approximately 1 to 10 ft/d near the Operations Area to over 1,000 ft/d at a distance of approximately 2,000 ft south of the former Operations Area.
Bedrock Geology. The bedrock consists of the Upper Triassic New Haven Arkose “red beds” (Rogers 1985) see Figure 11-4. Bedrock fractures in the region dip moderately to the east-southeast, parallel to the bedding (Hubert 1978; Rogers 1985; Blasland 1998). Steeply dipping fractures, however, have also been observed in outcrops near the site, and in core samples and downhole fracture-logging results within the study area. While normal faults have been mapped approximately 2.5 miles west and 2.0 miles east of the site (Rogers 1985), no bedrock faults have been reported within the Remedial Investigation (RI) Study Area.
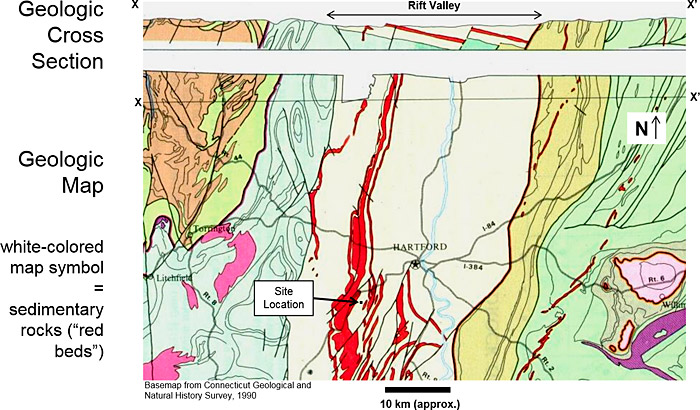
Figure 11-4. Portion of Connecticut bedrock geologic map.
Bedrock Investigations
Bedrock investigation methods at the SRSNE Site are summarized with pink shading in Table 11-1. Each data-gathering step was linked to one or more classes of data needs/uses and collection methods. Investigations included the following:
- optical and/or acoustic televiewer logging of fracture orientations and spacing.
- fracture orientation stereonet plots (such as those in Figure 11-5).
- rock core sampling and laboratory analysis of matrix parameters that affect VOC solute transport (porosity, bulk density, organic carbon content).
- fracture aperture calculations – the average hydraulic aperture in 41 borehole intervals was calculated as b = C (Kb S)1/3, where b is the average hydraulic aperture (cm), Kb is the interval bulk hydraulic conductivity (cm/sec), S is the average fracture spacing in the interval, which is the total interval length divided by the number of fractures in the interval (cm). This equation is based on Zeigler’s work (Zeigler 1976). The constant C accounts for gravity and water viscosity, and is equal to 0.0543 at 10°C, the representative groundwater temperature at the site.
- vertical profiling of bedrock boreholes prior to installing wells in deep bedrock boreholes.
Table 11-1. Matrix of data needs and data collection methods
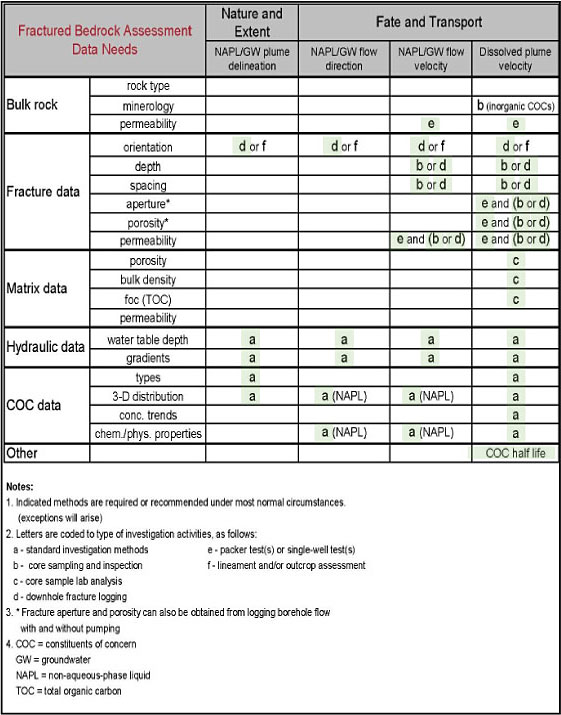
At four deep bedrock boreholes drilled to depths of at least 200 ft below ground surface (bgs), extraction packer tests were performed at 20-foot intervals to measure hydraulic conductivity and collect screening-level groundwater samples for VOC analysis. To help ensure that drilling water was adequately purged from the surrounding fractures before sampling, fluorescein was added to the drill water and monitored during purging (McCaughey IN PRESS).
To help avoid dense NAPL (DNAPL) remobilization, the bedrock DNAPL zone was investigated using a “DNAPL Contingency Plan” prepared by Dr. Bernard Kueper, Ph.D., P.Eng., of Queens’s University.
Bedrock Characteristics
Lithology. The bedrock in the study area is the New Haven Arkose (Rogers 1985), which consists of red to reddish-brown to pink, interbedded sandy to silty channel deposits and silty floodplain sediments deposited in a rift setting known as the Hartford Basin (Fritts 1963; Hubert 1978); also see Figure 11-4).
Bulk hydraulic conductivity. The geometric mean hydraulic conductivity from specific-capacity tests at 69 bedrock monitoring wells is approximately 0.2 ft/day. The range is 0.001 to 27 ft/day.
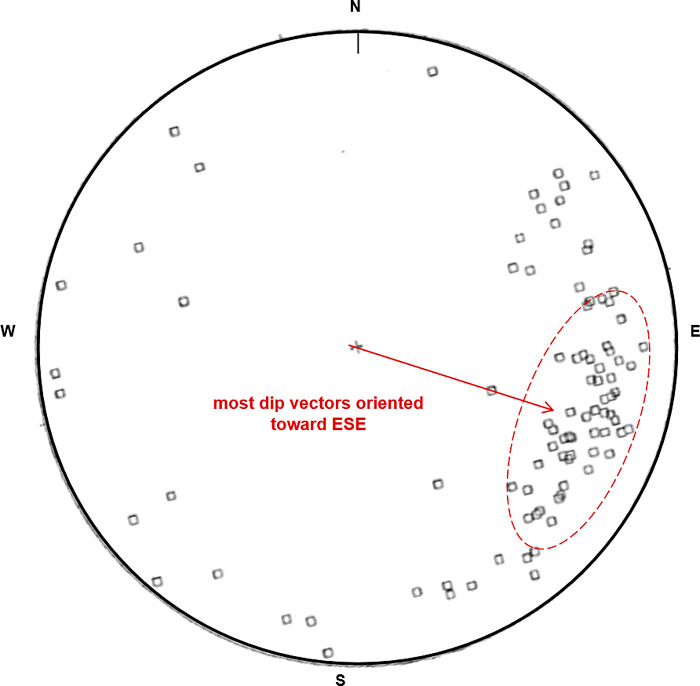
Figure 11-5. Equal area stereonet of measured fracture dip vectors.
Fracture orientations, hydraulic apertures, spacing and hydraulic conductivity. Based on Borehole Image Processing System (BIPS) data collected at three deep bedrock holes during the RI(for the 94 fractures observed in these boreholes the mean dip direction was 107.53 degrees (east-southeast) and the mean dip angle was 22.06 degrees (Figure 11-5). Most of the fractures observed via BIPS and in core samples paralleled bedding. Based on the numbers of fractures and hydraulic conductivity values for 41 injection and extraction packer-test intervals, the mean fracture aperture and spacing are 0.0097 centimeters (cm) (97 microns) and 155 cm, respectively. The fraction of the entire bedrock volume occupied by fractures, meaning the “fracture porosity”, equals the mean aperture divided by the mean spacing, or 6.3×10⁻⁵ (0.0063 %). The mean bedrock fracture has a hydraulic conductivity of approximately 7×10⁻¹ cm/sec, or 2,000 ft/day.
Matrix porosity, bulk density, fraction of organic carbon and permeability. Laboratory analysis of 18 core samples during the RI indicated that the unfractured matrix of the bedrock has an average porosity of 7.7%, bulk density of 2.52 grams/cubic cm, and fraction of organic carbon (foc) of 0.0049. The ratio of matrix porosity to fracture porosity shows that the matrix has over 1,000 times more storage capacity than the fracture system for dissolved solutes. The mean matrix permeability was measured as 4.2×10⁻⁷ cm/sec, or 0.00011 ft/day, indicating that VOC mass transfer to and from the matrix occurs mostly by diffusion rather than advection. The matrix data provided a means to account for VOC sorption in the matrix in solute transport modeling.
Bedrock Groundwater Hydraulics
Generalized Groundwater Flow Directions. Groundwater in the overburden and bedrock converges toward the Quinnipiac River from the east and the west, and generally has a southward component consistent with the southerly slope of the valley. Based on hydraulic heads measured at 227 wells, piezometers, and surface-water measurement points within the RI Study Area, nearly all overburden and bedrock groundwater within the monitored depth discharges to the Quinnipiac River. The exception is groundwater extracted by plume containment wells. As bedrock groundwater migrates southward, it also rises into the overburden. Long-term hydrographs at pairs of shallow and deep bedrock wells indicated vertical hydraulic connection within the bedrock.
Hydraulic Conductivity Across Bedding. The bedrock hydraulic conductivity perpendicular to the plane of bedding was estimated based on the drawdown responses at observation wells during pumping at individual specific capacity test wells. Neuman-Witherspoon analysis (Sen 1989) suggested that the vertical to horizontal anisotropy of the bedrock is approximately 1:200.
Plan-View Anisotropy Due to Dipping Fractures. The plan view anisotropy of the bedrock was estimated using the equation (Anderson 1992):
Kx/Ky = R/[1 – (1 – R) cos2A]
where:
Kx = horizontal hydraulic conductivity parallel to the strike of bedding plane fractures
Ky = horizontal hydraulic conductivity in the dip direction
R = hydraulic conductivity perpendicular to bedding (Kp)
Kb = hydraulic conductivity in the plane of bedding
A = dip of bedding.
Taking the calculated vertical to horizontal anisotropy of 1:200 as a rough approximation for R and using the dip angle of approximately 20⁰, the estimated a plan view anisotropy of Kx / Ky is approximately 1/20.
A regional MODFLOW model was developed to help design hydraulic containment systems for the VOC plumes in the overburden and bedrock. Initially the bedrock layers were assigned equal horizontal K values in both model grid directions (Kx= Ky). The model calibrated closely to measured hydraulic heads, but the bedrock particle tracks calculated by MODPATH paralleled the hydraulic gradient toward the east-southeast, which did not match the elongate shape of the VOC plume toward the south. After changing the plan view anisotropy to the calculated value of Kx/Ky = 1/20, the model was still well-calibrated to hydraulic heads and the MODPATH particle tracks reasonably matched the shape of the bedrock VOC plume. In applying the calculated 1/20 plan view anisotropy, the product of Kx and Ky was held constant. Note the angle between the hydraulic gradient and the particle tracks with arrows (Figure 11-6).
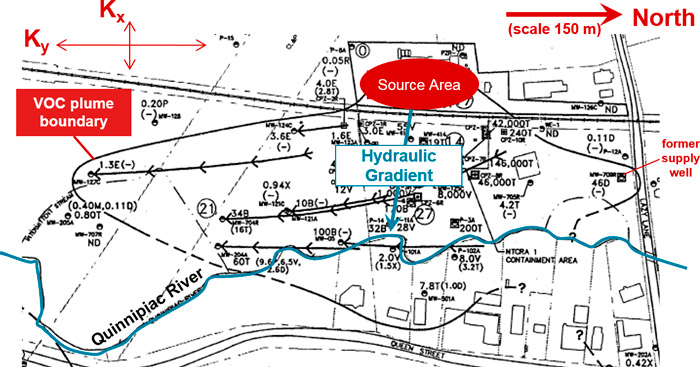
Figure 11-6. Particle tracking results using 1/20 plan-view anisotropy.
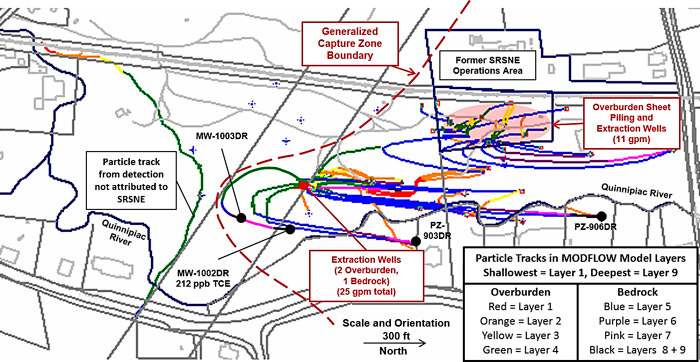
Figure 11-7. Hydraulic containment simulation with forward particle tracking from wells with VOCs above drinking water standards.
Plume Containment. Using the calibrated MODFLOW model with 1/20 plan view anisotropy, a bedrock hydraulic containment system was designed including overburden and bedrock extraction wells. Consistent with USEPA guidance, the capture zone was verified using multiple lines of evidence, including: modeling, hydraulic head mapping using numerous bedrock monitoring wells, and VOC concentration trend analysis at wells downgradient of the interpreted capture zone (USEPA 2008). Based on particle tracking simulations using a calibrated regional MODFLOW/MODPATH groundwater flow model, all monitoring wells where SRSNE-related VOCs have been detected above drinking water standards are within the capture zone established by the hydraulic containment and treatment system (Figure 11-7). The total pumping rate for all the extraction wells is typically 35 to 45 gallons per minute.
Bedrock DNAPL Zone Evaluation
During the RI, DNAPL was encountered in the overburden and the bedrock, and light NAPL liquid (LNAPL) was encountered in the overburden. NAPLs in each unit were delineated at two levels of relative confidence using multiple lines of evidence, consistent with research (Kueper 2009):
- Probable NAPL zone was delineated based on direct observations of NAPL, site history, anomalous VOC distributions or accepted technical principles based on effective solubility limits of NAPL constituents.
- Potential NAPL zone serves as safety factor around the probable NAPL zone, but also is consistent with effective solubility principles recognized as indicating the potential nearby presence of NAPL (USEPA 1992).
Comparisons to effective solubility accounted for the multicomponent DNAPL chemistry (Kueper 2009). The bedrock NAPL zone boundary delineated during the RI is shown on Figure 11-8. The potential bedrock NAPL zone was interpreted as extending generally east-southeast (down the dip of bedding plane fractures) from the former SRSNE Operations Area, but also northward (along strike) to the location of a former bedrock supply well that was used for truck washing.
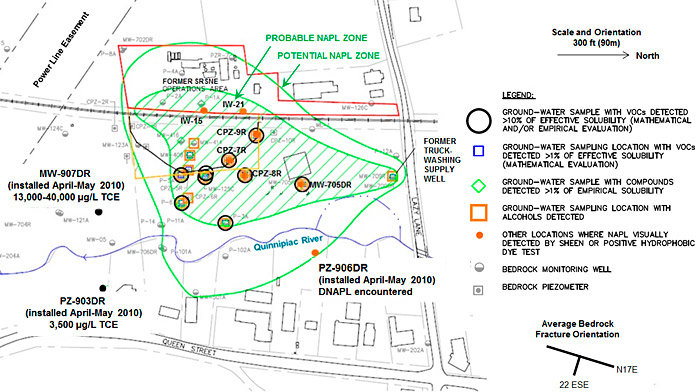
Figure 11-8. Probable and potential NAPL zone boundaries in bedrock delineated during 1998 RI.
Evaluation of Potential Downdip DNAPL Extent. During remedial design/remedial action (RD/RA) field investigations in 2009 and 2010, additional monitoring wells were installed to fill certain data gaps. One of the additional bedrock boreholes drilled at the eastern edge of the potential NAPL zone delineated during the RI (PZ-906DR; Figure 11-8) encountered DNAPL in fractures 170 to 177 ft bgs, 100 to 107 ft below the top of rock. PZ-906DR produced 13.4 gallons of DNAPL in six months, then stopped producing DNAPL. The DNAPL was chemically and physically similar to DNAPL samples previously collected at updip locations west of the Quinnipiac River, and consisted primarily of TCE with minor components of other organic compounds. This boring highlights the uncertainties in delineating NAPL in fractured rock, even a “Potential NAPL Zone” is used as a safety factor.
Figure 11-9 shows a 3-D Mining Visualization System (MVS) model looking toward the north-northeast along the average strike of the bedrock fractures and showing the shape of the interpreted bedrock DNAPL zone. Specific 3-D locations with visible DNAPL and/or sheens in bedrock are shown, and their locations align well with the average bedrock fracture orientation. DNAPL may extend even further downdip than PZ-906DR, and where DNAPL exists it dissolves and contributes to the plume of VOCs within the bedrock groundwater. Due to topography and drill-rig access limitations, direct delineation further down dip would likely require drilling many boreholes over 450 ft deep. Also, due to the complexity of DNAPL migration in fractured rock, delineation of mobile DNAPL by drilling cannot be considered definitive.
Estimate of VOC Mass in Bedrock
Dissolved and Sorbed VOC Mass. VOC attenuation has been observed within the bedrock groundwater, with an average bulk attenuation half-life of approximately 5.8 years in the shallow bedrock (top 30 feet of bedrock) and 17 years in the deep bedrock. These results are based on the temporal trend of total VOC concentrations in bedrock monitoring wells. Based on the mapped distribution of total VOC concentrations in the bedrock, the depth of the impacted bedrock and partitioning characteristics of the VOCs in the site-specific bedrock matrix, the total estimated VOC mass remaining in the dissolved and sorbed phases in the bedrock is approximately 12,000 kg.
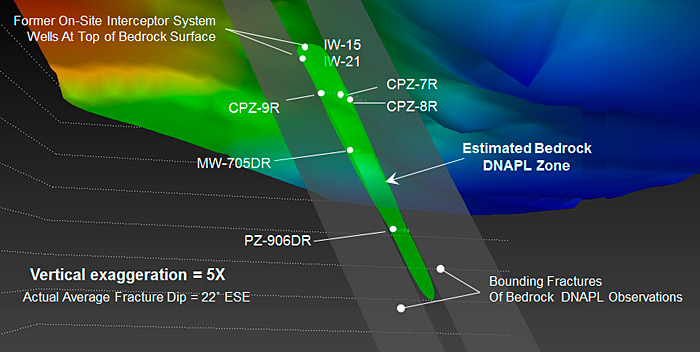
Figure 11-9. MVS model view toward east-northeast along average strike of rock fractures, with locations of NAPL or sheen in bedrock. Colorful surface at top is bedrock surface.
DNAPL Mass in Bedrock. As shown on Figure 11-9, the plan-view area of the revised probable DNAPL zone in bedrock is approximately 500,000 sq ft (11.5 acres). Based on MVS modeling and the locations where DNAPL has been observed in bedrock wells, the vertical extent of this zone is estimated as 60 ft, and oriented parallel to the average bedrock fracture dip. Thus, the total volume (Vtot) of the bedrock DNAPL zone is estimated as 30,000,000 cubic feet.
The DNAPL volume within the bedrock (VDb) was estimated as:
VDb = Vtot Rb
where:
Vtot = total volume of the bedrock DNAPL zone
Rb = DNAPL bulk retention capacity within the bedrock DNAPL zone
The bulk retention capacity, Rb, can be calculated as:
Rb = Qfx Rfx F%
where:
Qfx = fracture porosity (6.3×10⁻⁵)
R fx = retention capacity of a single fracture contacted by DNAPL
F% = estimated percentage of the fracture porosity that has been contacted by DNAPL
Laboratory research indicates that the retention capacity of a single bedrock fracture with an approximately 20° dip following DNAPL entry and drainage is approximately 7% to 17% (Longino and Kueper 1999). A single-fracture retention capacity value of 12% was assumed in these calculations. The term F% accounts for the fact that, at the field scale, not all the fracture porosity within the probable DNAPL zone was invaded by DNAPL. Given the complex and variable nature of the bedrock fracture network geometry, aperture distribution, and fracture surface roughness, it is estimated that DNAPL may have contacted only 10% to 30% of the total fracture porosity within the probable DNAPL zone in the bedrock. Assuming the DNAPL contacted 20% of the fracture volume, the resulting bulk retention capacity is approximately 1.5 x 10⁻⁶ (1.5 x 10⁻⁴ %).
Based on the total volume of the revised probable DNAPL zone in bedrock and calculated bulk retention capacity, the DNAPL volume within the bedrock is estimated as 1,300 liters. Assuming an average DNAPL density of approximately 1.2 kilograms per liter (kg/L), this quantity equates to 1,500 kg.
Fracture Apertures Decrease with Depth
Figure 11-10 summarizes calculated bedrock fracture apertures versus depth below the top of rock. Each black data point represents a bedrock borehole interval where the mean hydraulic fracture aperture was calculated based on the measured interval K and average fracture spacing. The red dots indicate that the aperture of the specified intervals was below the indicated value, because the hydraulic conductivity value was below the lower measurement limit. The calculated fracture apertures generally decrease with depth. This finding is consistent with data reported by (Snow 1968) for sandstone and shale (gray data in Figure 11-10). With increasing depth, the weight of the overlying rock increases. The effective stress increases and causes the fracture walls to deform and flatten, decreasing the fracture apertures. Figure 11-10 also shows the fracture apertures that were assumed for TCE solute-transport modeling.
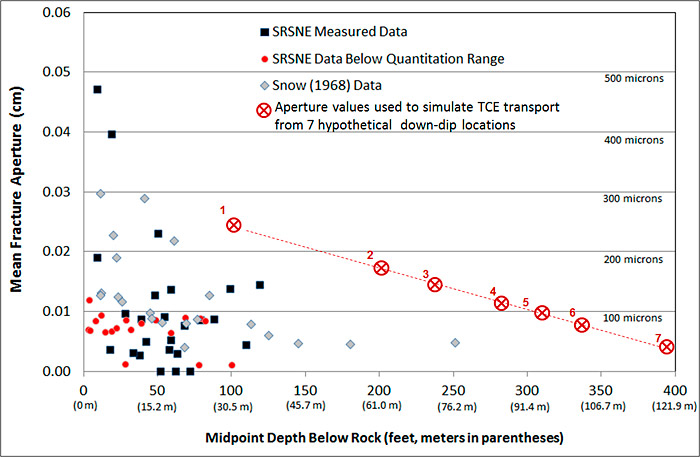
Figure 11-10. Mean fracture aperture versus depth below top of rock.
Solute Transport Modeling Approach
The Record of Decision for the site requires complete delineation and hydraulic containment of groundwater with VOCs above risk-based levels/MCLs. The downgradient extent of the bedrock NAPL zone and the eastern edge of the VOC plume in the deep bedrock east of the river were evaluated using a combination of particle tracking and discrete-fracture solute-transport modeling. TCE was selected for modeling because it has been detected at the highest concentrations relative to its drinking water standard in the area of interest, and it is the predominant constituent of the DNAPL. The dual-domain solute-transport analytical solution (CRAFLUSH), which was used to predict the dissolved plume length along select flow paths, is based on the work of Sudicky and Frind (Sudicky 1982).
The modeling approach assumes that DNAPL extends further down dip from PZ-906DR. A line of seven hypothetical down-dip plume starting points was considered, extending from a depth of 104 ft—consistent with the depth of DNAPL at PZ-906DR—to 392 ft below the top of rock (Figures 11-9, 11-10 and 11-11). Fracture apertures were assumed to decrease linearly with increasing depth. The estimated aperture at each depth was approximately two to four times larger than the largest measured or reported aperture value. The assumption of relatively large fracture apertures is believed to be conservative for the plume starting points, but also accounts for the expectation that as the plume migrates, it will flow upward within the bedrock and encounter increasing fracture sizes.
Other model input parameters include:
- bedrock matrix parameters based on site-specific measurements, as presented by Lipson et al. (2005)
- average fracture spacing (155 cm)
- measured hydraulic gradient component parallel to groundwater flow (0.005)
- constant TCE source concentration of 780,000 µg/L, as detected in groundwater above a DNAPL layer at bedrock well MW-705DR (Figure 11-12
- TCE degradation half-life (1,350 days)
The estimated half-life is based on mildly to moderately reducing conditions observed in bedrock groundwater east of the river (nitrate-reducing to iron-reducing) (Aronson 1997), but may be conservatively high (USEPA 2002b; Suarez 1999). The simulation time of 50 years was found to produce steady-state conditions (constant plume length and concentration profile in the direction of flow).
Modeling Results and Discussion
Two model “realizations” were developed, based on two bounding estimates regarding the potential southward extent of the DNAPL zone. For each realization, the conceptual boundaries of the bedrock NAPL zone were adjusted as shown on Figures 11-12 and 11-13. Realization # 1 evaluates the potential bedrock plume that would result if DNAPL extends further down dip from the location of PZ-906DR (Figure 11-12). Realization #2 evaluated the potential bedrock plume that would result if the DNAPL zone extends further south, directly down-dip from the former SRSNE Operations Area (Figure 11-12).
With increasing distance down dip, in the east south-east direction, the predicted steady-state plume length decreases due to decreasing fracture apertures and therefore decreasing groundwater velocity. The plume lengths shown on Figure 11-11 for starting point 1, and on Figure 11-12 for starting points 1 and 2, do not extend to the full calculated distance because those simulated particle tracks exit from the shallow bedrock (blue) to the deep overburden (green). Along the other particle tracks, the TCE plume is predicted to reach the MCL
before flowing upward to the top of rock. The estimated plume length downgradient from starting point 7 is approximately 30 ft. If DNAPL extends further down dip, beyond point 7, the fracture apertures would be expected to further decrease with depth and the resulting plume length would also be shorter than 30 ft, regardless of the down-dip DNAPL migration distance and depth.
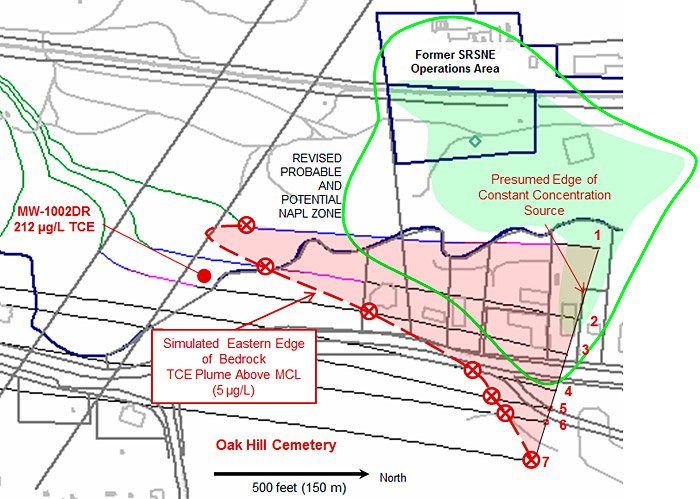
Figure 11-11. Realization #1 simulation results and “verification well. MW-1002DR.
Verification
Following the modeling work summarized above, a focused drilling and sampling program was performed to refine the bedrock DNAPL Zone and TCE plume boundary east of the river. Bedrock monitoring well MW-1002DR was drilled in February-March 2012 at a location between the eastern edges of the plumes predicted in Realizations #1 and #2 (Figures 11-12 and 11-13). Well MW-1002DR was installed with a screened interval of 171 to 186 ft bgs, where the highest TCE concentration was detected during vertical profiling (extraction packer tests samples). Sampling results from the new well indicated TCE at 212 µg/L. This detection disagrees with the results of Realization #1 (Figure 11-15), which predicted <5 µg/L at that location, but is reasonably consistent with Realization #2 (Figure 11-16). Based on the results presented above, the plume depicted in Realization #2 is believed to reasonably represent the steady state TCE plume in bedrock groundwater east of the
river. The potential NAPL zone in bedrock is interpreted to extend southward to the vicinity of point 3 shown on Figure 11-12, but the modeling results also account for the possibility that DNAPL could extend further down-dip to the east.
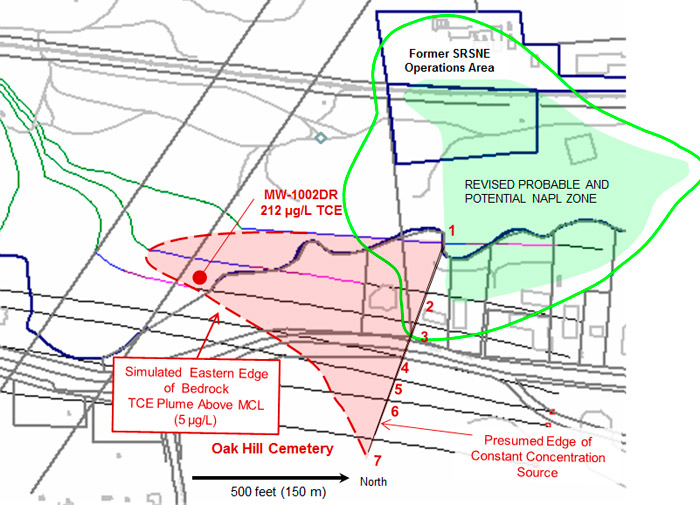
Figure 11-12. Realization #2 simulation results and “verification well. MW-1002DR.
Conclusion: No Completed Risk Pathway
Current and future risk and exposure are controlled, because: (1) VOCs do not exceed drinking water standards at wells beyond the capture zone of the hydraulic containment system, and (2) the plume is beneath a large cemetery and properties that will be subject to environmental land use restrictions. Also, an existing town ordinance prohibits drilling or use of potable water wells in the area. A focused drilling and sampling program has provided a basis to refine the bedrock TCE plume boundary location and, combined with modeling results, indicates that the potential for a completed risk pathway is extremely remote. USEPA indicated that this work completed the requirements for VOC plume delineation required in the ROD.
Lessons Learned
Through decades of work in the bedrock at the SRSNE Superfund Site, the following lessons have been learned:
- In this dipping, sedimentary bedrock setting, the orientations of the predominant fractures were inferred based on the mapped orientations of stratigraphic bedding but also confirmed via down-hole (in situ) fracture orientation measurements followed by stereonet analysis.
- Using groundwater flow modeling and particle tracking, the plan-view anisotropy can be calibrated within a bedrock formation to match the overall shape of a solute plume in bedrock.
- Calculating representative fracture hydraulic apertures is straightforward using bedrock intervals with known numbers of fractures and bulk interval hydraulic conductivity. At this site, the calculated hydraulic apertures decrease with increasing depth below the top of bedrock, consistent with expectations based on literature.
- DNAPL delineation is challenging, particularly in fractured bedrock. Even after using multiple lines of evidence and including a factor of safety (potential NAPL zone) drawn around the probable NAPL zone during the RI, DNAPL was encountered near the down-dip edge of the potential NAPL zone during the RD/RA. This result illustrates the importance of using a safety factor in DNAPL zone delineation.
- By measuring bedrock fracture orientations, apertures and spacing, and matrix parameters that affect solute-transport, solute-transport can be simulated in a manner that explicitly accounts for matrix diffusion and is useful for conceptual model development and risk evaluation.
- Using modeling and a well-developed, quantitative site conceptual model, it is possible in some cases to reduce drilling and complete the delineation of a deep bedrock VOC plume sufficiently to confirm the absence of a completed risk pathway.


