3 Hydrology: Fluid Flow
This section examines fluid flow at three physical/investigation scales that are relevant for fractured rock:
- macroscopic (regional flow and flow across sites)
- mesoscopic (flow at a site scale)
- microscopic (flow in the rock matrix and between microfractures, typically investigated at the sub-centimeter scale)
At each of these scales, nine key characteristics influence fluid flow in fractured rock. Although these characteristics are generally present at all scales, the focus of this discussion are those characteristics most relevant to fracture flow at each individual scale. Most of these characteristics are not as relevant to unconsolidated porous media, and recognizing the differences between the two systems is critical to designing an effective remedial strategy in fractured rock.
Understanding fluid mechanics is key to characterizing fractured rock sites, with special consideration of the vapor phase and its differences compared to fluid flow in fractures. For purposes of this guidance, any type of fluid flow (such as NAPL or DNAPL) is considered similarly as “fluid.” See Section 4 for additional information on contaminant transport as it pertains to fluid flow in fractured rock.
There are inherent limits to observing and evaluating the nine characteristics and their influence on flow. The physical scale of a particular feature or mechanism largely determines how it influences a particular remediation problem. See Case Studies for specific applications using the tools and techniques to characterize and remediate fractured rock sites. In comparison to sites underlain by unconsolidated sediments, fractured rock sites often require additional evaluation to understand the characteristics influencing fluid flow.
3.1 Fractured Rock Characteristics
The characteristics intrinsic to fractured rock that influence fluid flow, direction, and storage include:
- matrix lithology
- orientation
- aperture
- infilling
- length
- density
- connectivity
- planarity or waviness
- roughness
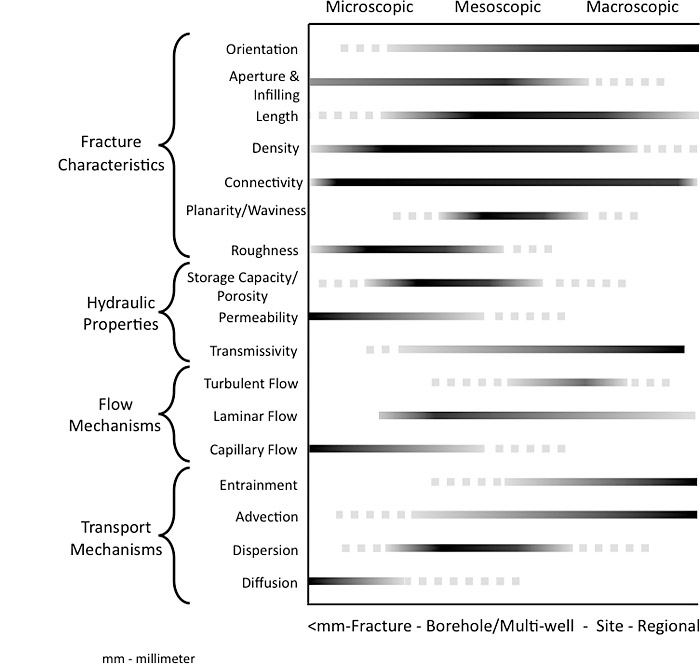
Figure 3-1 presents a range of fracture characteristics, hydraulic properties, and flow and transport mechanisms that are addressed directly or indirectly by scale (microscopic, mesoscopic, and macroscopic). See Section 5.4 and Section 5.5 for discussions on establishing data collection objectives, designing data collection process, and selecting investigation tools to characterize these properties.
Figure 3-1. Range of fracture characteristics, hydraulic properties, and flow and transport mechanisms.
While these characteristics are always present to some degree in fractured rock (Figure 3-2), their relative importance for fluid flow varies depending on the observational scale of interest. Certain characteristics may be negligible with regards to fluid flow, depending on the scale.
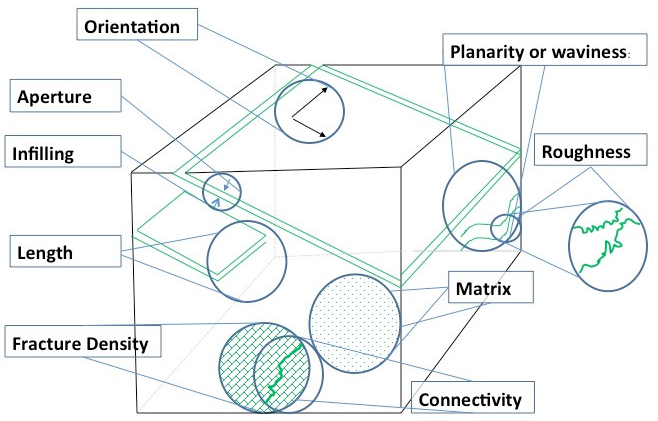
Figure 3-2. Fracture characteristics.
3.1.1 Matrix Lithology
Rock matrix type or character refers to the lithology (from a mineralogical and petrological perspective), grain or crystal size distribution and fabric, primary porosity (void spaces, which can include microfractures), inorganic and organic cementation/binding materials and their stability, bedding planes, paleochannels, sedimentary sequences with variable grain size, grain imbrication, lineations, nonconformities, and overall connectivity within the primary porosity network. Depending on the lithologic sequence, typical planar features can also be applicable to planar fractures. These combined matrix properties control the storage of contaminants in rock, connected fractures, and flow through the matrix.
The key features that influence storage and flow potential in fractured rock are matrix porosity (primary porosity), matrix intrinsic permeability, and the properties of the fluid of interest, respectively. Typical ranges for total porosity of common rock types are presented in Table 3-1. These ranges include the matrix porosity and fractures (secondary porosity). Matrix porosity is not always higher than fracture porosity for given fractured rock. In general, fracture porosity typically determines overall contaminant flow potential.
Table 3‑1. Porosities for common rock types
| Rock Type | Total Porosity (%) (Matrix and Fractures) |
|---|---|
| Claystone/Mudstone | 21-451 |
| Shale | 0-101,2 |
| Siltstone | 21-451 |
| Fine grained sandstone | 14-491 |
| Medium grained sandstone | 30-44 1 |
| Limestone/Dolomite | 0-40 2 |
| Karst Limestone | 0-50 2 |
| Tuff | 7-551 |
| Basalt | 3-501,2 |
| Gabbro (weathered) | 42-451 |
| Granite (weathered) | 34-571 |
| Fractured Crystalline Rock | 0-10 2 |
| Dense Crystalline Rock | 0-5 2 |
| Schist | 4-49 1 |
| 1(Morris 1967) 2(Davis 1966a) |
|
3.1.2 Fracture Orientation
Stereographic Projection
The stereographic projection is used in structural geology and engineering to analyze the orientation of lines and planes with respect to each other. The stereonet is a type of standardized mapping system that represents various angles in 3D space on a 1D paper.” (Wiki 2013)
Fracture orientation is the position of a fracture in three-dimensional space, typically defined by the strike of the fracture (the compass direction of a horizontal line on the fracture plane face), and its dip (or maximum slope angle of the fracture plane angle measured off the horizontal perpendicular to the strike). Fracture orientation of multiple fractures making up particular fracture sets is often represented using stereographic projections. Fracture orientation generally constrains the potential directions in which fluids can flow in a fractured rock system. Above the water table or vadose zone, aqueous fluid flow generally runs down the face of the structural feature (down dip). In the saturated zone, aqueous fluid flows along the face of the structure or fracture (along strike), although the degree to which it does so depends on both the dip angle and the gradient direction at and below the water table. Vapor phase above the water table may flow freely along a fracture plane; however, fracture orientation generally influences the potential directions that fluids can flow in a fractured rock system.
The block diagrams in Figure 3-3 illustrate how strike and dip control flow of aqueous and nonaqueous phase liquids in a fracture and how different apparent plume patterns emerge depending on boreholes, wells, and depth. Figure 3-3a Vertical Structure, Figure 3-3b Steeply Dipping Structure and 3-3c Simple Shallow Dipping Structure.
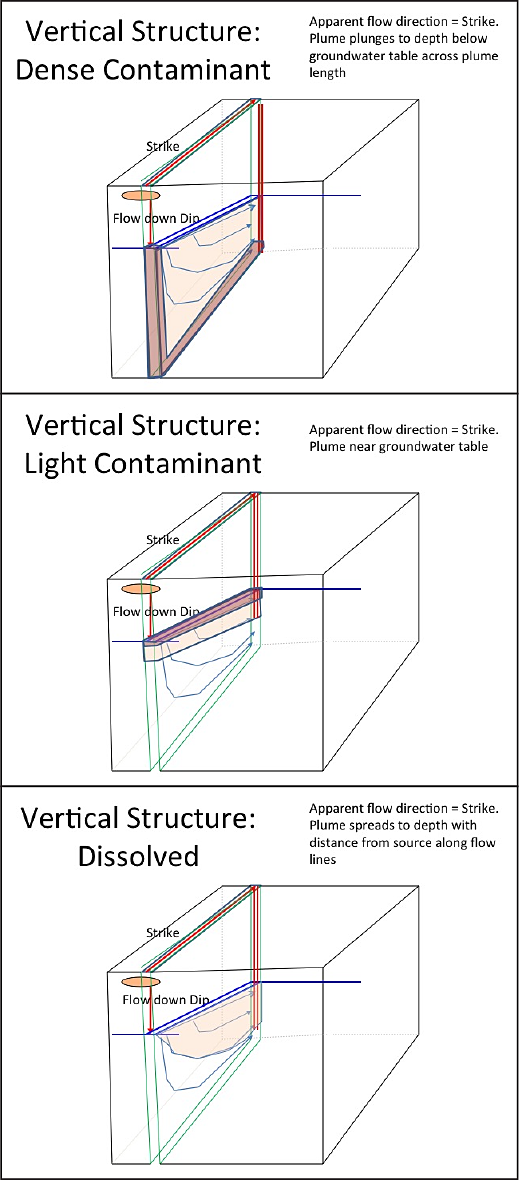
Figure 3-3a
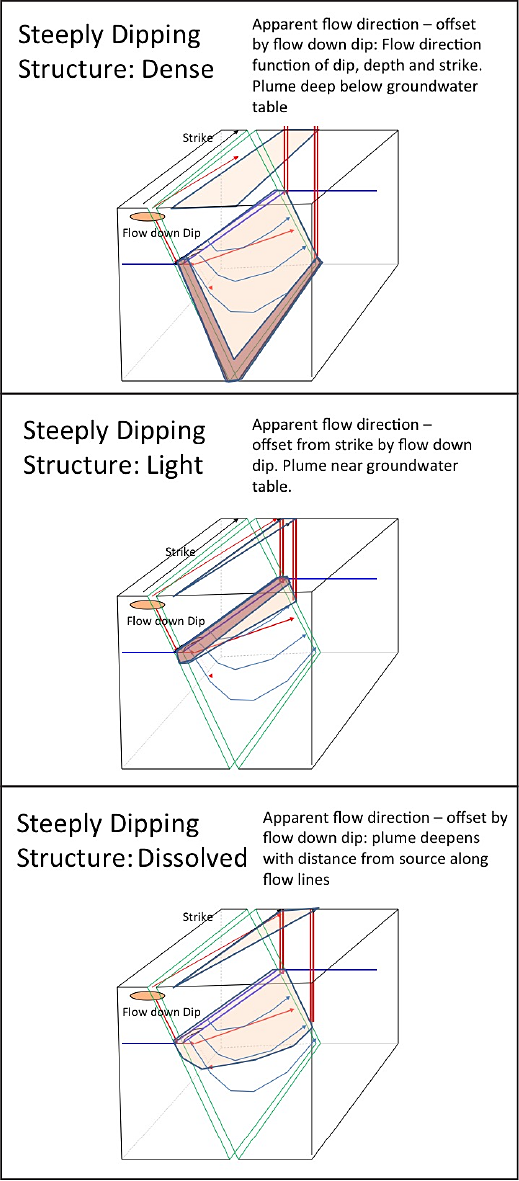
Figure 3-3b
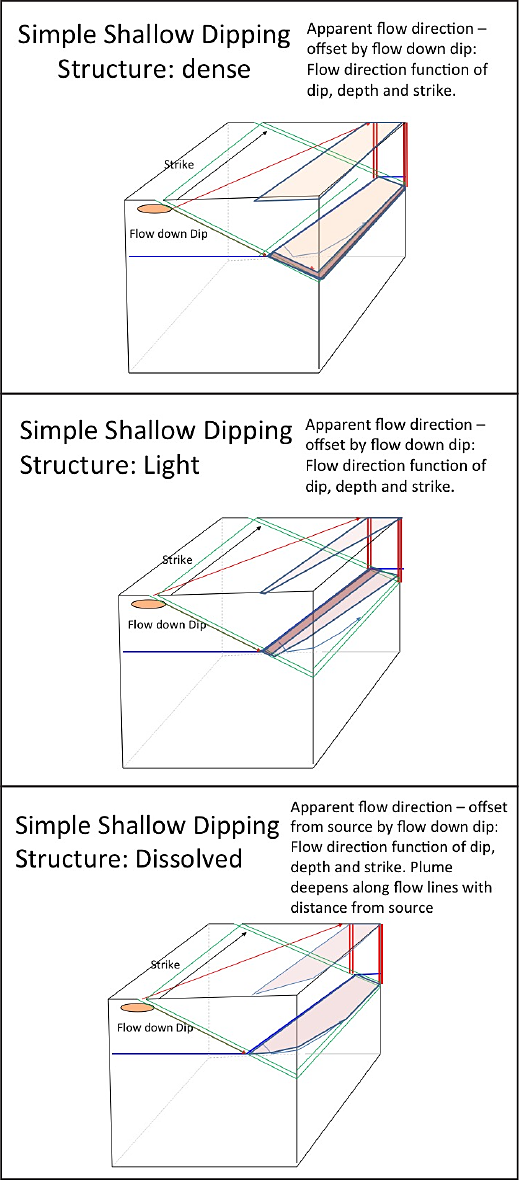
Figure 3-3c
Figure 3-3. Block diagrams illustrating strike and dip and influence on flow in a borehole or well located within fractured rock: a) vertical fractures b) steeply dipping c) simple shallow dipping).
Anisotropic rock systems vary with respect to groundwater and dissolved-phase aqueous flow in a rock formation. For example, dipping fractures exert differing degrees of anisotropy. A continuum of anisotropy exists ranging from the vertical fractures (maximum anisotropy) to horizontal fractures, which impart no anisotropy. Many intermediate anisotropies exist between these two extremes. It is important to collect hydraulic parameters, such as hydraulic gradient and conductivity, in multiple dimensions to evaluate the degree of anisotropy in a fractured rock system. Alternatively, if anisotropy of the fractured rock system is well understood, these variations in hydraulic gradient and conductivity parameters may be effectively estimated based on single dimension measurements or empirical estimates.
Figure 3-4 presents three examples of the continuum of anisotropy that can occur in fractured rock. Example A represents a strongly anisotropic fractured rock system, which is vertically fractured. In this example, the groundwater flow direction is largely determined by the strike of the fracture, but the prevailing hydraulic gradient also plays a part. If the fracture strike is north-south, then the groundwater is constrained to flow either north or south, depending on the direction of the prevailing hydraulic gradient. As the dip angle lessens, an inclined fracture is produced (Example B) and variable flow directions become possible, depending on both the prevailing gradient direction and the fracture strike orientation. Example C illustrates a horizontal fracture imparting no anisotropy; the system is isotropic and the flow is controlled entirely by the gradient direction. A gently dipping fracture would also be similar, but not identical, to Example C. This fracture would act much like Example C, even though it has a defined strike; a multitude of flow directions would be possible, with the actual direction being largely determined by the gradient.
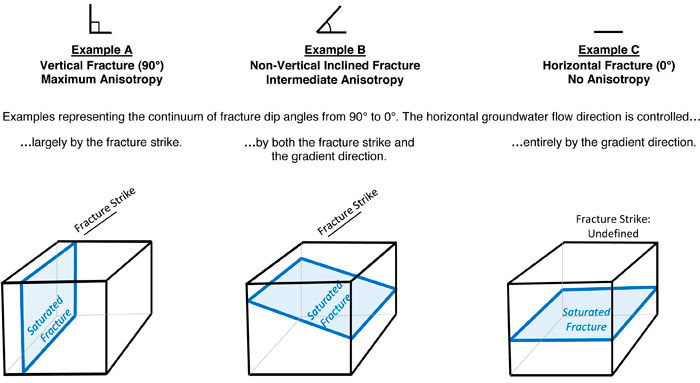
Figure 3-4. Influence of fracture dip angle on flow and anisotropy.
3.1.3 Fracture Aperture and Infilling
Fracture aperture is the width of the unfilled fracture opening. The fracture aperture can vary over time and space due to changes in in situ stress fields or dissolution and precipitation caused by rock weathering and biogeochemical processes. The larger the cross-sectional area of a fracture (width times height), the greater the flow capacity. For an idealized parallel-sided fracture under laminar flow conditions, a general cubic power law relationship exists under laminar flow conditions (Snow 1969), where a ten-fold increase in fracture cross-sectional area results in a thousand-fold increase in flow capacity.
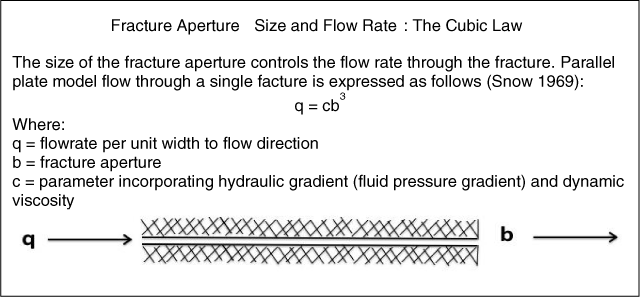
Figure 3-5. Fracture aperture and flow rate.
Assuming all other fracture characteristics are equal, the mean fracture aperture size (b) is the feature that controls the specific discharge. At the site-wide scale, a single, high-aperture fracture may dominate flow over a large number of fractures with much smaller apertures (Shapiro 1987).
An aperture’s size may vary significantly along a fracture, causing flow channeling within the fracture and deviations from the general cubic law. Additionally, fracture apertures can contract or expand or vary over time due to mineral dissolution or precipitation (resulting in infilling). Modifying subsurface conditions with hydraulic depressurization or pressurization, heating, and introducing chemicals and microbes (solutes and particles) can influence aperture configuration and flow potential. For example, infilling in a fracture reduces the effective aperture of the fracture, which leads to a proportional reduction in the flow capacity. Fracture infilling may be the result of a variety of phenomena, including sedimentary deposition, chemical precipitation, weathering, biofilms, or cementation. The degree and type of fracture infilling can change with time as the processes of weathering, biofilm growth, and sedimentation may vary during the life cycle of a project. For example, infill material has its own hydraulic properties that may affect flow (see Chapter 4 regarding lithogeochemical effects of fracture infilling or rock matrix). Furthermore, some in situ treatments can leave residual material that limits aperture sizes.
3.1.4 Length
The longer the fracture, the further a fluid volume can travel unimpeded. Longer fractures are more likely to intersect other fractures, increasing the potential flow-field volume and overall distance the fluid can travel.
3.1.5 Density
Fracture density describes the degree or intensity of fracturing and can be represented as the linear density (per unit length), areal density (per planar surface area), or volumetric density (per unit rock volume). The more fractures there are and the closer they are together, the greater the fracture connectivity and the higher the overall void space in the rock, which translates to higher fluid flow and storage potential. The volume of groundwater flowing through a series of closely spaced, small aperture fractures may be equivalent to the flow through a single large fracture, depending on the aperture size and length.
3.1.6 Fracture Connectivity
A single fracture rarely spans the entire length of an investigated area—the degree to which fractures connect to each other influences the overall flow volumes and patterns. Fractures that do not intersect may be filled with fluid; however, little or no flow may be observed. Collectively, the fractures with the lowest flow capacity in an interconnected system may effectively constrain the volume of flow through that system. Conversely, fractures that intersect allow fluids to migrate along fractures that typically have vector components, with migration both down dip and along strike (not all down dip, then along strike). Groundwater plume delineation is sometimes described as a stair-step pattern because wells are located progressively down dip and along strike (see Figure 3-6; also see (Davis 1966b).
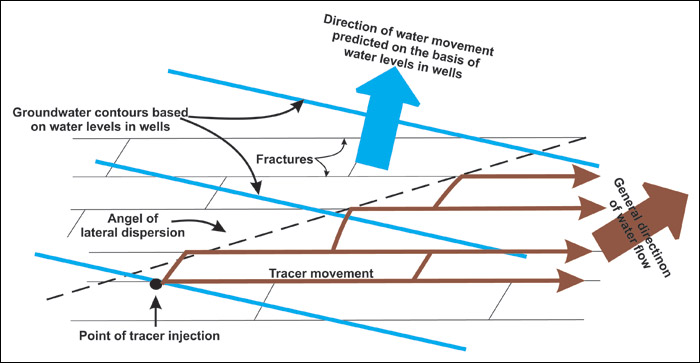
Figure 3-6. Plan view of orientation and connectivity of fractures controlling the overall direction of flow, and the direction of the apparent hydraulic gradient.
3.1.7 Fracture Planarity or Waviness
A planar, open fracture offers fewer barriers to flow, while a planar, closed fracture, such as a horizontal bedding plane fracture experiencing significant overburden pressure, may create an effective barrier to flow. Conversely, the more undulating or wavy, a fracture may be, the more likely it is to be open, especially if the two sides of the fracture are displaced relative to each other.
Local resistance to flow occurs where the fracture surfaces touch. As few as three to five percent of the fracture plane surface area in contact with its corresponding surface may cause significant deviation from the cubic law (Oron 1998), so it is important to consider how waviness may affect the amount of surface contact on a fracture system.
3.1.8 Fracture Roughness
The greater the roughness of a fracture, the greater the effective surface area per unit volume of the fracture resulting in generally greater frictional resistance to flow. With increased fracture roughness, the potential for transported material in the fracture to be trapped by, or to adhere to, the fracture walls also increases. This characteristic can potentially lead to greater infilling and reduced fracture aperture, thereby reducing the volume of fluid flow through fractures by further reducing fracture aperture.
3.2 Fluid Dynamics
Fluid dynamics is the study of fluids in motion. This section introduces fluid dynamics effects on fractured rock flow. The flow of all fluids is influenced by pressure and density gradients, although the focus here is on fluid flow under pressure gradients.
Each individual fracture acts as its own confined aquifer under a unique head or gradient. It is therefore important to understand the differences in head between different fractures, particularly where fractures are widely spaced and connectivity may be low. At some sites, fractured bedrock can be treated as equivalent porous media containing a water table, depending on the combination of fracture density, orientation and spacing, the scale of observation, and the goals of the investigation. Other sites must be treated as discrete fracture networks with one or more piezometric surfaces, and no bedrock water table.
Open boreholes, which penetrate discrete fracture networks, have unique hydraulic characteristics compared to wells penetrating equivalent porous media or unconsolidated materials. Figure 3-7 is a cross-sectional view of three open bedrock boreholes in a generalized hydrogeologic setting. These boreholes are illustrated in more detail in Figures 3-8 through 3-11, which shows several possible hydraulic conditions of transmissive fractures within bedrock. For simplicity, the fractures are depicted as horizontal, although similar conditions are found in dipping fractures.
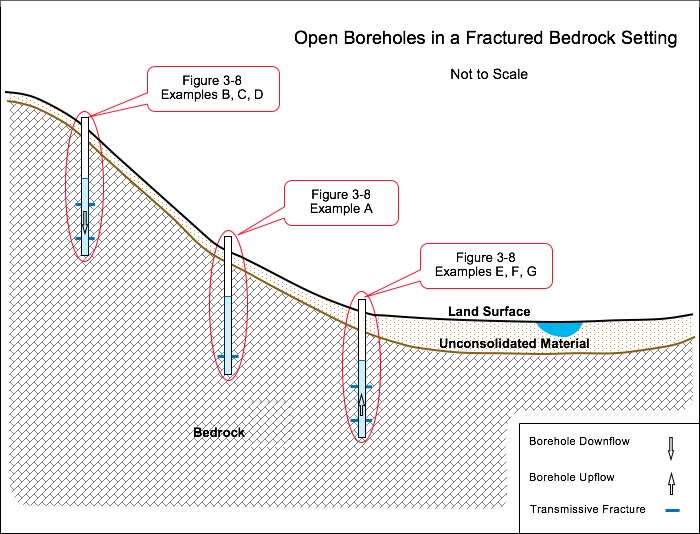
Figure 3-7. Open boreholes in a fractured rock setting.
Figure 3-8 illustrates the simplest case of an open borehole piercing one fracture. The fracture is, in effect, a confined aquifer, so the static water level in the borehole equilibrates at the piezometric surface (head) of the fracture. Disregarding weather-related effects, there is no natural vertical flow within the borehole. This condition could be encountered in areas of groundwater recharge or discharge.
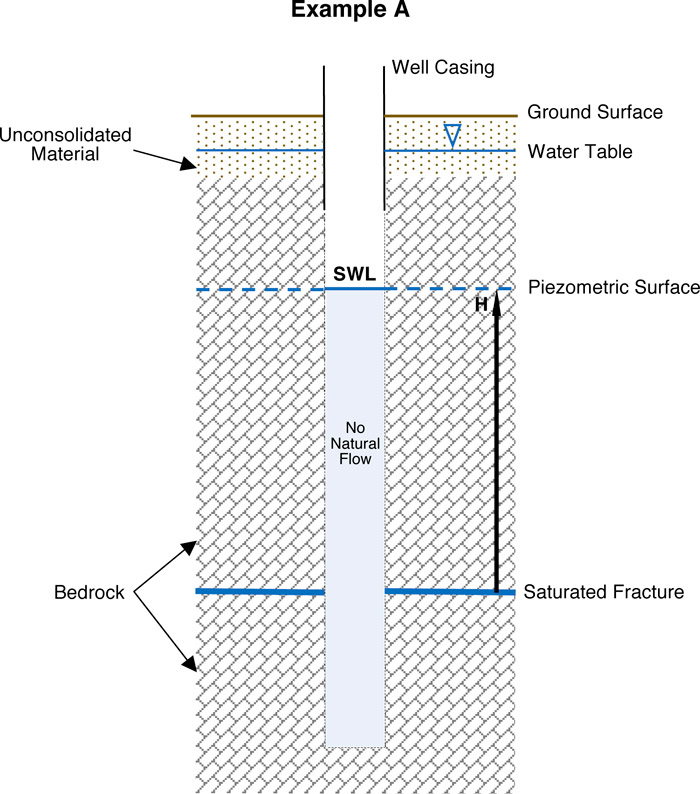
Figure 3-8. Open borehole piercing one confined fracture, no natural borehole flow (Not to Scale) H = Head; SWL = Static Water level
The same principles apply to multiple fractures, with respect the relationships among aquifer transmissivity, head, and water level in a well penetrating a multiaquifer system (Sokol 1963). Figure 3-9 illustrates conditions that would be encountered in a dual-fracture system. Upon drilling through two fractures having different heads, a static water level (SWL) emerges that represents the piezometric surface of neither fracture. The SWL is at an average position of the two heads and is shown in Example B to be at the midway point between them. The SWL of a multifracture (and multiaquifer) system is a function of the heads and transmissivities of the fractures (aquifers).
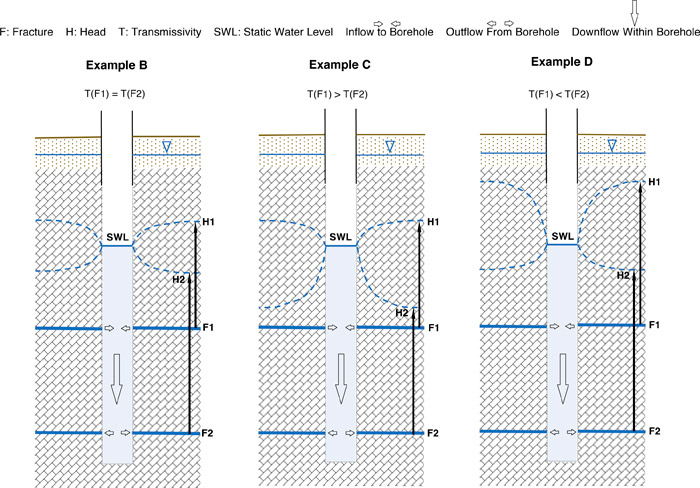
Figure 3-9. Open borehole piercing two confined fractures, natural borehole down flow.
The head in multiaquifer wells is described using the following relationship (Sen 1989):
Hw = ∑TiHi/∑Ti (i = 1, 2, …, n)
Where ∑ is the “…summation of discrete variables from i = 1 to i = n” (the number of fractures and corresponding transmissivities), Hw is “…a common steady-state piezometric level…” (the SWL), T is transmissivity and H is head.
Through this relationship, the SWL in the borehole is the composite (weighted average) head of the individual heads (piezometric surfaces). The composite head equals the arithmetic average of individual heads only when the fractures (aquifers) have identical transmissivity values (Sen 1989). In Figure 3-9, Example B, the transmissivities of Fracture 1 and Fracture 2 are equivalent, T(F1) = T(F2), so their respective heads are equidistant from the SWL. Because the fractures have different heads, there is a natural hydraulic gradient. Until the emplacement of the borehole, there was no permeable pathway interconnecting the fractures. A pathway was created when the borehole became part of the local hydraulic system. The head differential (gradient) combined with the pathway enables vertical flow to take place within the borehole. In this example, water enters the borehole from the high-head fracture (F1), flows down the borehole and exits through the low-head fracture (F2). The condition of a high-head fracture located above a low-head fracture is suggestive of a groundwater recharge area. The piezometric surface of F1 takes the form of a cone of depression because it is losing water to the borehole. Conversely, the piezometric surface of F2 takes the form of a cone of recharge because it is gaining water from the borehole. The piezometric surfaces are mirror images of each other because the fracture transmissivities are identical.
In Figure 3-9, Examples C and D represent similar conditions except that the transmissivities of fractures F1 and F2 are not equivalent. Consequently, the piezometric surfaces are not mirror images of each other. Example C illustrates piezometric surfaces that would occur if the transmissivity of F1 > F2. The SWL is weighted toward the head of the more transmissive fracture, F1. In Example D the transmissivity of F1 < F2. Therefore, the SWL is weighted toward the head of F2.
Figure 3-10 illustrates the same relative transmissivities as the previous three examples, except that the gradient and borehole flow direction are reversed. Borehole upflow is depicted in these examples. The condition of a low-head fracture located above a high-head fracture suggests a groundwater discharge area. In a case study of an investigation at the University of Connecticut Landfill, borehole geophysical testing revealed single, double, and triple fracture sets having upflow, downflow, convergent flow, and divergent flow (Johnson 2005).
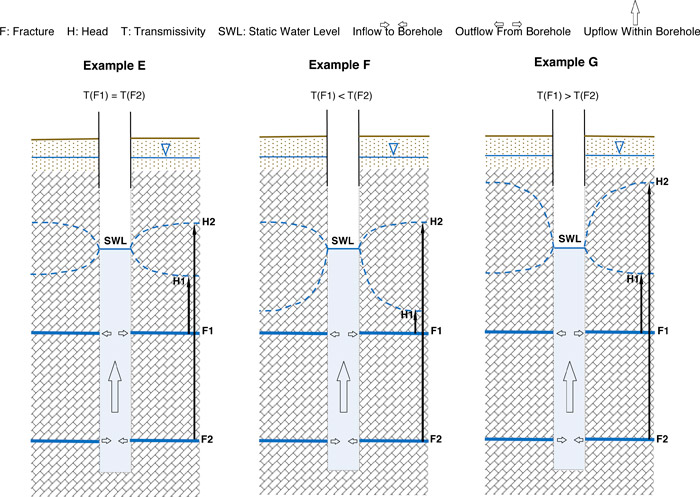
Figure 3-10. Open borehole piercing two confined fractures, natural borehole up flow.
Figure 3-11 illustrates what would be expected if the borehole in Figure 3-9, Example B were pumped down to a point where the pumping water level (PWL) was below the head of Fracture 2 (H2). The piezometric cone of recharge associated with F2 inverts and becomes a cone of depression, because F2 is now contributing water to the well. F1 continues to contribute water but its cone of depression takes on a steeper form. In this example, the water flows vertically in the borehole from both fractures to the pump intake. Note that F2 produces water only because the PWL is lower than H2. If the PWL were higher than H2, then only F1 would produce water.
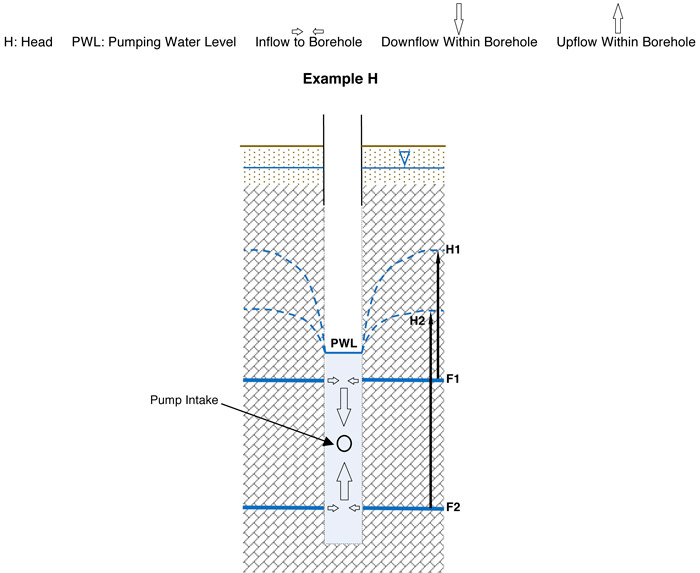
Figure 3-11. Open borehole two confined fractures pumping condition (not to scale)
In the preceding examples (B through G) of dual-fracture boreholes under steady-state conditions, flow occurs due to the head difference between transmissive fractures. If F1 and F2 had the same head, by being connected by another fracture, they would have a common piezometric surface and there would be no natural borehole flow.
Fluid flow in the subsurface can be characterized in terms of the volume of flow through a unit cross-sectional area under a certain pressure differential across two points in the flow field – in effect, Darcy’s Law. Darcy’s Law assumes the subsurface acts as a continuum and that what is measured at one scale applies at other scales of the system. Using Darcy flow assumptions for a complex fractured rock system may or may not lead to a representative conceptualization of the flow system, depending on the degree of fracturing and of interconnectedness and on the scale of observation.
Fluid flow can be characterized as linear or laminar, and can be modeled using Darcy’s Law. Conversely, fluid flow can also be characterized as nonlinear or nonlaminar (not necessarily following Darcy’s Law) or turbulent (non-Darcian). For example, flow in karst and pseudo karst terranes is likely to be turbulent, at least at some locations. Flow in an individual fracture may also behave in a non-laminar manner.
The difference between characterizing laminar flow versus turbulent flow is important when the additional energy loss associated with turbulent flow is significant enough to affect specific discharge. Turbulent flow can also cause greater dispersion of solutes compared to laminar flow. However, turbulent flow on a local scale (mesoscopic) scale can often be approximated at a larger scale regional or macroscopic) scale as laminar flow or Darcian flow without introducing significant conceptualization and predictive error. The larger the fracture relative to the system (scale of the problem) and the higher the gradient across the fracture system being evaluated, the more likely that the flow will not follow Darcy’s Law. The effect of scale is depicted in Figure 3-12.
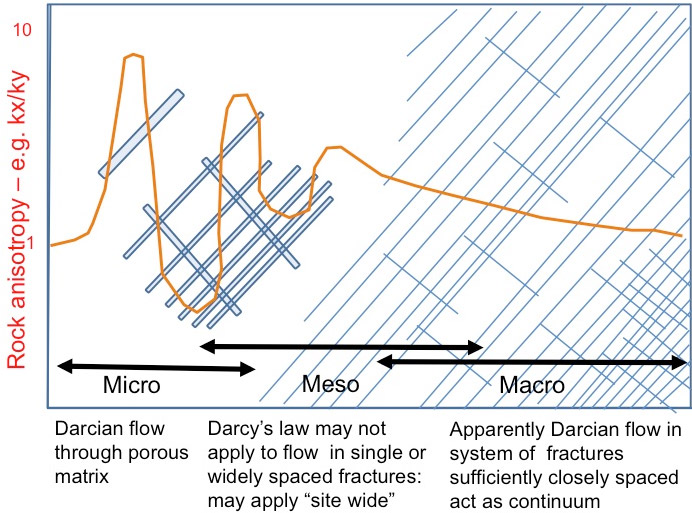
Figure 3-12. Generalized depictions of Darcian and Non-Darcian Flow
3.3 Vapors in Fractured Rock
With respect to the gas phase, a vadose zone can exist above the zone of groundwater saturation and within a fractured rock horizon of interest. Within the vadose zone, the gas phase is continuous and mobile, and the aqueous phase is the secondary, discontinuous, and potentially immobile wetting fluid. In these situations, the gas fluid phase flows through the fractured rock according to the same hydraulic principles as groundwater. Energy gradients and resistance to flow (such as frictional and gravitational forces) govern the flow of the continuous gas phase through fractured rock. Gases typically have very low viscosity and density compared to groundwater, and unlike groundwater, the gas phase is compressible. Thus, gas phase flow behavior can be different from groundwater flow even within the same fractured rock zone of interest. Often, compared to groundwater, the gas phase responds more dramatically to changes in pressure and temperature, even under natural conditions (for example, barometric pressure pumping).
Where liquid-phase organic or inorganic contaminants are encountered in fractured rock, a fraction of the volatile component of the contaminant may partition into the gas phase as solutes and undergo transport with the gas phase. If the concentration of the volatile organic contaminant in the gas phase rises, then the composite density and viscosity of the overall gas phase may cause significant deviation in gas flow behavior.
For the specific case of fractured rock vadose zone overlying saturated fractured rock, and where a volatile organic contaminant release is present in the saturated zone, the lateral and vertical extent of a vapor plume in the vadose zone may have an entirely different geometry from the groundwater contaminant plume mapped in the underlying saturated fractured rock. The volatile organic vapor phase density (and viscosity) is only a small fraction of the groundwater density (and viscosity) and the vapor plume acts as a compressible fluid. The permeability of the vadose zone rock matrix and fractures to gas-vapor flow is much higher compared to groundwater and the gas or vapor flow is more dynamic than groundwater under similar pressure gradients. Furthermore, fracture density is typically highest near the top of the rock column, where vadose zone (gas-saturated) conditions are more likely to be observed. Thus, unlike groundwater or other liquids, the gas phase may flow more freely in different directions and may be more likely to enter a turbulent flow regime more easily. The gas or vapor phase flow potential is more dynamic than groundwater and other liquids.
Because a gas phase is less dense and viscous than groundwater, when a mobile gas phase contacts a mobile groundwater phase, additional complexities may occur. Often dissolved gases that form within fractured rock systems, and under nonequilibrium conditions, can separate out of solution (exsolve) with subsequent formation of gas bubbles (a separate phase). Reactive or destabilizing interfaces within the fractured rock may hasten the formation of gas bubbles. Sufficient gas bubbles can lead to trapped and mobile continuous phases within the groundwater-saturated zone and influence groundwater flow behavior within the rock matrix and fractures.
3.4 Role of Scale in Fractured Rock Fluid Flow
The nine characteristics of fractured rock are always present to some degree at the macroscopic, mesoscopic and microscopic scales. Their relative importance to fluid flow varies with the observational scale of interest, and the understanding that certain characteristics may be relevant during site characterization or remediation. The scale of the problem is typically defined by the distance (ideally in three dimensions) between the location of known or potential sources and known or potential receptors. When developing the CSM, it is important to understand the effect of all the relevant scales and incorporate evaluation of their potential effects on groundwater flow at a given site.
3.4.1 Fluid Flow at Macroscopic Scale
The macroscopic scale refers to regional and multisite problems. At this scale, rock characteristics and flow behavior discernible over hundreds to thousands of feet become relevant. These characteristics would be described, for example, on aerial photographs or on a standard 7.5 minute USGS quadrangle topographic or geological map. The terrane information described in Chapter 2 can be used to define the flows likely encountered at this scale.
At the macroscopic scale, it is unlikely that one single structure hundreds or thousands of meters long dominates fracture flow. Instead, flow is more likely governed by a system of interconnected structures of comparable size, orientation and aperture resulting from the same geologic forces (Figure 3-8 and 3-9). Karst features may be defined as a single feature at this scale. The fracture network in each geologic unit is important because the orientation, length, and connectivity of fracture systems control flow at this scale, with flow behaving as a broadly continuous Darcian flow system with degrees of heterogeneity and anisotropy resulting from those characteristics. Where connectivity of fractures is low, highly transmissive fractures may be connected to fractures of much lower transmissivity, causing bottlenecks to flow (Shapiro 2007). In effect, the lower transmissivity fractures become the controlling fractures to overall flow volume.
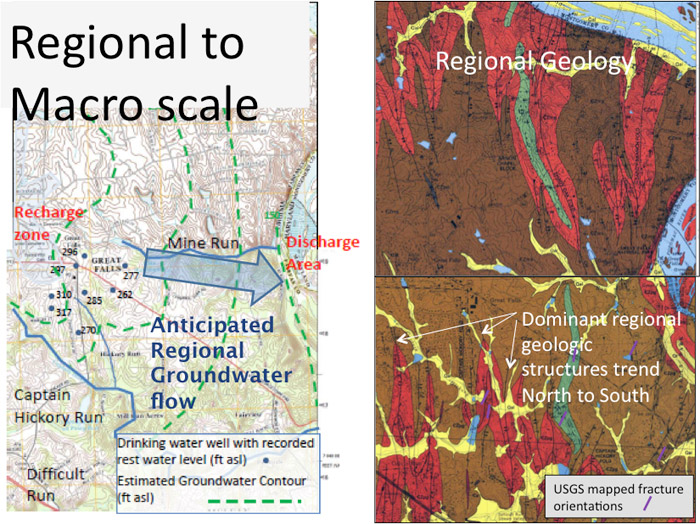
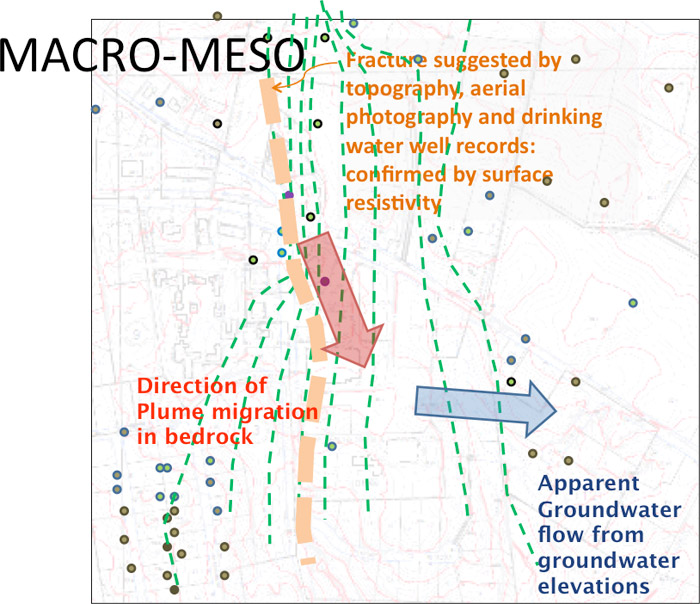
Figures 3-13. Generalized descriptions of flow regimes across the macroscopic and mesoscopic scales, illustrating how rock characteristics can impact flow directions.
Local aberrations in the regional flow field (or mesoscopic scale) can still result from discrete large-scale fracture effects on flow at the macroscopic scale. For example, long fractures are likely to connect with other fractures and are more likely to influence regional (macroscopic) flow and transport. Karst features, fault planes, and bedding planes are the good examples of macroscopic fracture systems that create a regionally influential flow features. Faults can enhance, redirect, or even terminate the continuity of flow depending on the orientation of fractures and on fault character. Many fault zones experience physical or geochemical infilling, restricting fluid flow over time. Therefore, CSMs and investigations for sites with identified fault features should be approached with an open mind in determining the ultimate role the faults play in influencing fluid flow.
3.4.2 Fluid Flow at Mesoscopic Scale
The mesoscopic scale refers to the scale of an individual project site, typically investigated by a number of site-specific boreholes. At this scale, features are typically not large enough to be recognizable on topographic maps or aerial photographs but can be important at the field scale and within and between individual boreholes.
The relative size of mesoscopic fractured rock structures fall on the continuum between large-scale macroscopic features and microscopic features. Figure 3-14 shows a reduction in apparent fracture aperture of one order of magnitude over 30 feet, with a three orders of magnitude reduction in apparent conductivity (as would be anticipated with from the cubic law). Rock characteristics can be deduced from geophysical surveys, observed within a borehole, or examined at a rock outcrop. As fracture density and size decrease with depth, although fracture apertures may remain similar, hydraulic conductivity may decrease with depth as more fractures become infilled. Individual fractures may be interconnected and several discrete flow paths may be present and identifiable within a single borehole (Gupta 1999), with order of magnitude changes in characteristics over small vertical and horizontal intervals.
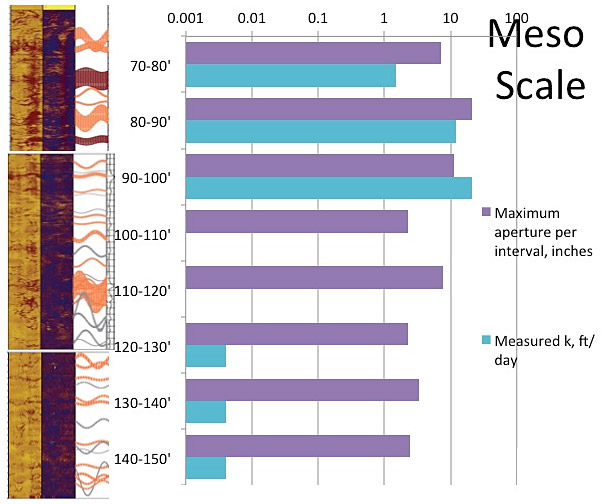
Figure 3-14. Generalized depiction of changes in flow characteristics over the mesoscopic scale [relationship of aperture size plotted and meaured hydraulic conductivity, K = hydraulic conductivity]
Fractures with low connectivity and discrete flow paths are often under separate pressure gradients at the mesoscopic scale and resolving these different pressure gradients is an important part of the site characterization process. The pressure gradient/head in particular fractures in one vertical sequence can vary significantly over small distances and respond in dramatically different ways to external events, such as pumping or rainfall, as shown in Figure 3-15.
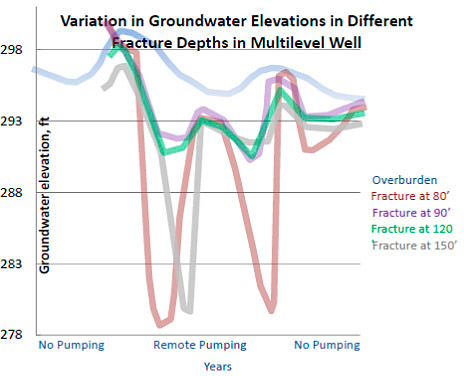
Figure 3-15. Variation of groundwater elevations in different fracture depths in a multi-level groundwater monitoring well.
As discussed in Section 3.1.2, aqueous fluid flow in these structures can be thought of as flowing down the face of the structural feature (down dip) above the water table and along the face of the structure (along strike) at and below the water table (Figure 3-6). Fracture orientation (strike and dip), aperture, density, length, and connectivity are the most important characteristics to consider at this scale (see Figure 3-1). At this scale, turbulent flow may occur in individual fractures. Fate and transport of contaminants is primarily through advection, entrainment, or both (Figure 3-1) and is described in detail in Chapter 4 .
3.4.3 Fluid Flow at Microscopic Scale
Microscopic features can represent significant storage of groundwater and contaminants, and their interaction with larger scale features can control fluid mobility (permeability of rock matrix) and thus contaminant mobility. Compared to the mesoscopic and macroscopic scales, high physical property contrasts or chemical/pressure gradients are likely present over small distances; however, these properties may be difficult to evaluate. Often, characteristics at this scale are evaluated in the laboratory or inferred from the available literature.
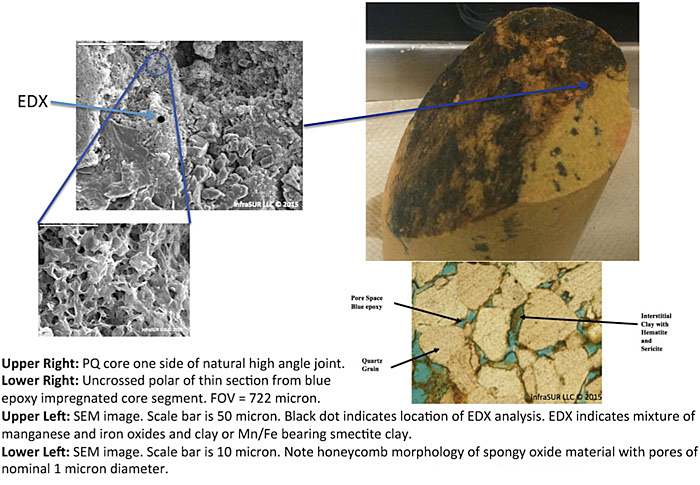
Figures 3-16. Matrix and fracture features at the microscopic scale, which may influence flow within fractures.
Source: InfraSUR, LLC
The microscopic feature of interest can vary depending on its spatial orientation of the feature relative to its surroundings, (such as the location in the matrix that is adjacent to the fracture surface). The same fracture characteristics (aperture, orientation, length, and density) used for mesoscopic and macroscopic scale applies at the microscopic scale (Figure 3-1). At the microscopic scale, characteristics of the rock matrix may be important; for example, matrix porosity, including grain size, pore shape, pore connectivity, crystal structure, cleavage, and microfractures (such as microcracks or microjoints). Microfractures may exist in all rocks, including rock that appears to be fresh or unfractured at the mesoscopic and macroscopic scale (Figure 3-16).
Flow at the microscopic scale occurs through microfractures or through the rock matrix. It may not be possible to differentiate flow through microfractures or the rock matrix. If the microfractures or pore space connectivity is sufficient, then advective flow may occur driven by pressure gradients at the regional and local scales (for example, between low and high permeability fractures). Where connectivity is less well developed, capillary flow may dominate.
Fluid interaction at the microscopic scale can influence flow at larger scales. Flow through the matrix and within fractures continually changes, and the geochemistry continually varies, which causes dissolution and precipitation of minerals as groundwater flows through the matrix and within fractures. Factors influencing these changes include: pH, reduction/oxidation, solubility limits, chemical concentrations, aqueous geochemical and biogeochemical influences, pressure, temperature, fluid/rock interaction and residence time, mineral alteration zones, and chemical weathering (Sausse 2001). Conversely, on one end of the water/rock interaction spectrum is the removal of rock mass to enlarge voids, and on the other end is mineral precipitation to the point where filled-in fractures may become barriers to flow (Neuman 2005).
Upon identifying the dominant characteristics influencing fracture flow, the next step in refining the CSM is to evaluate the chemical fate and transport of contaminants within these affected media. Contaminants may be transported by a variety of mechanisms (such as advection, dispersion, diffusion, and entrainment), which are further described in Chapter 4.

