
Data Types and Definitions
Understanding the types of data that must be collected for a fractured rock site characterization is crucial in selecting the appropriate tools (see the Tool Selection Worksheet). The data types for these investigations generally fall into three categories – geologic, hydrogeologic, and chemical – as described below.
Data Quality
Data quality can be described as follows:
Quantitative = Q , tool that provides compound-specific values tion based on traceable standards (such as μg/L, ppm, or ppbv)
Semi-quantitative = SQ, tool that provides compound-specific quantitative measurements based on traceable standards but in units other than concentrations (such as ng or µg) or provides measurements within a range
Qualitative = QL, tool that provides an indirect measurement (for example, LIF and PID measurements provide a relative measure of absence or presence, but are not suitable as stand-alone tools for making remedy decisions)
Sample Location
Sample locations are defined as follows:
Subsurface. The subsurface terrain (geology) is categorized as :
Unconsolidated – Sampling heads can often be pushed through an unconsolidated subsurface (for example, a poorly cemented sedimentary subsurface).
Bedrock – Bedrock is the general type of subsurface terrain that requires rotatory drilling methods (for example, intrusive igneous rock types such as granites, diorites, or extrusive igneous rocks such as basalt, rhyolite, or andesite and metamorphic rock terrains). Weathered bedrock and weak bedrock may not require rotary drilling to penetrate – not unconsolidated in the strict sense. This is a source of confusion. Disintegrated consolidated or weakly indurated does not necessarily equate to unconsolidated.
Hydrologic Zones. The subsurface consists of two hydrologic zones:
Unsaturated (vadose zone), where the pores are saturated by gas and groundwater but not fully by either (got to be careful because saturated zone can be e.g., 98% gw saturated and 2% gas saturation)
Saturated (groundwater zone), where the pores of the rock terrain are completed filled with groundwater. Whether unconfined or artesian the pressure at every point in the saturated zone is greater than or equal to atmospheric pressure.
Geology
Geologic data provide a means to describe the physical matrix and structure of the subsurface and to classify the sedimentary, igneous, or metamorphic environment. Data related to lithology and distribution of strata and facies changes are generated through a variety of qualitative and quantitative collection tools and methods.
Initial methods and tools used to characterize site geology include site walkovers to help gain a preliminary understanding of the site prior to a major field mobilization, which can involve the use of both intrusive and nonintrusive tools. Outcroppings offer insight into structural features of the bedrock, and much information can be obtained through basic geologic mapping techniques (for example, measuring strike and dip of planar features and plotting on a stereonet).
Following a surface investigation, the next step in site characterization commonly involves collecting a continuous core of sediments and bedrock. Data provided by this core sampling may include mineralogy, lithology, grain size and sorting, crystalinity, geologic contacts, bedding planes, fractures and faults, depositional environment, porosity, and permeability. Generally, numerous boreholes are drilled to determine the vertical and horizontal variability of the site-specific geology. The depositional environment and facies changes should also be mapped as much as possible, and these data may be combined with surface and borehole geophysical data to interpolate conditions between the holes. Downhole geophysical tools and direct-push tools – for example, membrane interface probe (MIP), hydraulic profiling tool (HPT), and Waterloo profiler – can provide detailed information on the geology and contaminant distribution at a site.
Effective site geology characterization requires that personnel are trained and experienced in field geology and are able to accurately assess the collected data. It is also important that the team use consistent investigative methods – for example, characterizing soil or rock type using the same, agreed upon classification system. The team must determine the level of data resolution necessary to adequately characterize a specific site and whether surface and borehole geophysical data are of sufficient resolution.
Unfortunately, collection efforts at contaminated sites often yield insufficient geologic data, leading to a high degree of uncertainty in subsurface interpretation. Historically, there has been a tendency to oversimplify conceptual site models (CSMs), which has led to the misperception that physical (geologic) conditions of the site can be engineered around – that is, limitations in site characterization data can be compensated by overdesigning remediation systems. However, remedy performance success rates have been poor under such circumstances, whereas investing in adequately detailed site characterization has provided a positive return on investigation in terms of improved remedy success rates and reduced life cycle costs.
Oversimplification of CSMs is particularly relevant to glaciated regions with complex depositional environments. In the northeast and Midwest, many glaciated sites contain both bedrock and glacial aquifers that have contaminant issues. Under such conditions, hydrogeological and geological expertise specific to glacial environments and their depositional characteristics is required for developing an accurate and complete CSM.
Lithology
The physical attributes of a bedrock outcrop or rock core or cuttings can be described by a trained geologist using visual cues, perhaps with the aid of a magnifying hand lens and mineral acid. The bedrock attributes are rock type, grain size, mineralogy, color, fabric, texture, and small-scale features. The information from a lithologic inspection is general by nature and often only the most obvious features are described. For example, a typical outcome from a lithologic inspection of a sample might be “brown, well-sorted medium grained quartz sandstone with calcite cementation and cross bedding”. While this description is very useful, each feature could be described in more detail, perhaps quantitatively. For example, a lithologic inspection may document the typical grain size distribution of a sample as “well-sorted, medium grained.” On the other hand, a petrographic analysis (see Petrology) including several techniques including sample grinding followed by sieve and hydrometer analysis, would return a quantitative (and more accurate and useful) characterization to include a full distribution curve where the sample character can be compared quantitatively to other samples.
Certain tools can be applied to indirectly indicate one lithologic attribute. For example, borehole electrical resistivity logging can be used to rapidly identify horizons of differing lithologic character such as sandy (higher resistivity) versus clayey or shaley (lower resistivity).
Many rock characteristics that may be important are not included in the definition of lithology but might be included in the definition of other “column headings” in the tools matrix such as petrology or chemistry/biogeochemistry of solid media.
Lithologic information on a bedrock sample can be used to infer the site-wide geology and correlate the site setting into the more regional setting. This in turn, opens up the possibility for the knowledge base from regional and vicinity geologic, hydrogeologic, and contaminant studies to be extrapolated to the site.
Lithologic Contacts
A lithological contact is the surface between different lithological units. Lithologic changes may be defined by sharp boundaries (lithologic contact) between sediments or rock of different type (for example, shale and sandstone), or they can be transitional, changing from one sediment or rock type into another over several inches or feet (for example, sand grading to silty sand to silty-clay to clay). This may be a conformable contact (similar geologic history, not representing an erosional surface) or a nonconformable contact (representing a change in geologic history and erosional/nondepositional period). Lithologic contact data are important in site characterization as they delineate lithological units for the geological model and identify the potential for contaminant flow and transport and DNAPL pooling at the contacts.
Porosity
Porosity is the ratio of void volume of open space to total volume within sediment or rock. Porosity is generally expressed as a percentage of the total rock or sediment volume that is open space.
Primary porosity is the volume of void space that results from sediment deposition, settling, and lithification. Primary porosity is generally most important in sediments, unconsolidated formations, and sedimentary rocks. Igneous and metamorphic rocks generally have significantly less primary porosity, except for some igneous rocks such as vesicular basalts. Secondary porosity is represented by the open voids created after sediment deposition, settling, and lithification processes by a variety of mechanisms: (1) structural activities, including mineral alignment during metamorphosis (foliation); (2) faulting and fracturing of rock or sediments through plate tectonics; (3) fracturing caused by stress imbalances, such as those involved in isostatic rebound; and (4) chemical dissolution of limestones.
Porosity can change over time due to a variety of mechanisms such as chemical precipitation of minerals (for example, calcium carbonate and silicates in pore spaces) or dissolution along fluid flow paths. Porosity values are important for understanding the fluid storage capacity of the system. High porosity values may indicate the potential for significant mass storage at contaminated sites.
Dual Porosity
Fractured rock has primary porosity primary (rock matrix or micro fractures) and secondary porosity (fractures and partings of all types). This is a significant difference with characterization of unconsolidated porous media. Whereas, with few exceptions (for example, fractured till), primary porosity dominates fluid flow in an unconsolidated porous media.
Faults
A fault is created when a rock mass undergoes failure due to stresses or strains. When a rock mass fails, two masses of rock move past each other at a low angle (thrust fault) or high angle (normal or reverse faults). In the process of these two masses shifting by each other, part of the rock is fractured, brecciated, and pulverized along a fault plane. The pulverized material commonly creates a fine-grained material along the fault plane, known as fault gouge, which usually has low permeability. Conversely, coarse-grained fault breccias (larger clasts) may exhibit very high permeability unless secondary mineralization has filled the voids and pore spaces. The two rock masses are also highly fractured for a certain distance from the failure point, commonly referred to as the fault damage zone. Depending on the distribution of the rock gouge and the geometry of the fault damage zone, faults can act as barriers to flow perpendicular to the fault or enhance flow parallel to the fault, or as complicated combinations of barrier with enhanced flow in both directions. Understanding a fault’s effects on groundwater flow is important in developing a CSM for a site that contains faults.
Fractures
A fracture is a planar feature in rock in which brittle deformation (separation or cracks) has occurred. A fracture generally forms in rock when external stresses exceed the strength of the rock. Fractures in clays can occur through desiccation and associated shrinkage. In low-permeable media, fractures dominate the flow system and can act as the primary contaminant transport pathways (NRC 1996). Individual fractures may constitute a significant groundwater flow pathway and contaminant conduit; however, fractures must be interconnected to form a continuous flow path to act as preferential flow zones. It is therefore important to determine which fractures act as continuous features and which are nontransmissive; this determination is usually made through hydraulic testing.
Fracture Density
Fracture density is the number of fractures in a unit length of a rock hole. This is a poorly defined term; however, the number of fractures in a given length of matrix can be an indicator of the potential effect of secondary porosity and even permeability.
Fracture Orientation
Fracture sets are groups of similarly oriented fractures in a rock. Fracture sets are often
associated with other fracture sets that have cut across each other at consistent, definable angles. It is important to characterize fracture sets, as they constitute critical elements of the structural fabric of bedrock aquifers and may strongly cause preferential effects on contaminant transport.
Rock Competence
Rock competence reflects the degree of fracturing, where a highly competent rock has very few fractures. Determining where the rock is competent is important in defining hydrogeologic flow units.
Mineralogy
Rock mineralogy is the study of chemistry, crystal structure, and physical (including optical) properties of minerals and mineralized artifacts contained in a rock matrix. Specific studies within mineralogy include the processes of mineral origin and formation, classification of minerals, their distribution, and geochemical condition.
Hydrology
Hydrogeology is branch of geology that studies groundwater flow. The main hydrogeologic parameters in Darcy’s Law are hydraulic conductivity and hydraulic gradient. Hydraulic conductivity is usually determined by in situ hydraulic tests, while hydraulic gradient is determined from hydraulic head measurements at three or more points in the flow system. Both of these parameters can vary vertically and horizontally in all groundwater systems. In particular, hydraulic conductivity can vary by orders of magnitude vertically over short distances in some geologic environments. Lateral changes in hydraulic conductivity within a sediment or rock unit also may occur. Often this is due to a facies change across the unit (for example, sand grading laterally to sandy silt, to silty clay, to clay over distances of a few to many meters). This lateral change is often less dramatic, but still may have significant influence on contaminant fate and migration. Hydrogeologic units are commonly created by combining the geology and hydraulic data sets relying on head distributions in the system. While hydraulic head patterns may be relatively uniform throughout a hydrogeologic unit, the hydraulic conductivity can vary.
Knowing the flow distribution is fundamental in predicting the potential fate and transport of the contaminant. Interfaces between media of differing hydraulic conductivity can determine the migration of DNAPL and the diffusion of contaminants from high-conductivity units into adjacent low-conductivity units. Sufficient hydrogeologic data must be collected to minimize the uncertainty of the CSM with regard to contaminant flux (see ITRC 2010). Direct-push logging methods – for example, HPT, electrical conductivity, cone penetrometer, laser-induced fluorescence (LIF), and MIP – can be key in defining hydrostratigraphic facies and contaminant relationships in unconsolidated hydrostratigraphic units.
Open Hole Flow
Open hole flow occurs in a vertical hole drilled through porous media. Vertical flow occurs inside the borehole due to differences in hydraulic head with depth. There are many cases in which boreholes intersecting two aquifers create vertical migration of contaminants from the upper to lower aquifer (that is, cross connection). This phenomenon often occurs in fractured rock boreholes and care must be taken to minimize the time the hole is left open at contaminated sites to prevent this cross connection. Even short periods of cross connection can cause long-term effects due to matrix diffusion (Sterling et al. 2005).
Open hole flow measurements can be made to determine the direction and magnitude of vertical groundwater flow within the borehole and identify the contribution of individual fractures to flow into and out of the borehole. However, the highest flow zones in the open hole dominate the response, and moderate- to low-flow zones (where contaminants may be stored) will not be identified.
Ambient Flow
Ambient flow reflects the normal horizontal and vertical flow of groundwater under natural gradient conditions. This forms the baseline for further testing of fate and transport of a contaminant. It is especially important at fractured rock sites because zones exhibiting high conductivity, based on forced gradient tests, may not be well connected to contaminated or recharge zones, and therefore will not provide very active migration pathways under natural conditions.
Vertical head gradients may be present in unconsolidated sediment and rock aquifer systems. A significant upward gradient may inhibit the downward migration of contamination, while a significant downward gradient may accelerate the downward movement of contaminants. The installation of multilevel piezometers, FLUTe liners, or Westbay systems may be needed to define vertical gradients in consolidated aquifers. In unconsolidated formations, multilevel piezometers, HPT logs, or Waterloo Profiler logs can be used to define vertical gradients, if present.
Groundwater Age
Isotope analysis can be used to identify recharge areas and estimate the travel time of the water from the recharge source. For example, if the groundwater sample is young, the aquifer presumably is being replenished with modern water from the surface; therefore, the aquifer is vulnerable to contamination from above. Relative aging along a flow path is also used to determine the travel time between two points in the flow system; however, the geometry of the flow system, including recharge and discharge areas, is essential for reliable interpretation.
The stable isotopes deuterium (2H) and oxygen-18 (18O) serve mainly as indicators of groundwater source areas, and as evaporation indicators in surface-water bodies. Radioactive isotopes are used to infer age by measuring the amounts of the isotope in the sample and knowing the rate of decay. Common radioactive isotopes, including tritium (3H) and carbon-14(14C), are produced naturally in the atmosphere by the interaction of cosmic rays and nitrogen; 3H was naturally incorporated into water molecules and 14C into carbon dioxide. When these isotopes enter groundwater, they become isolated from the atmosphere, and thus the radioactive decay process dominates the change in concentrations over time. However, calcite and dolomite, which are generally of much older origins and present in many groundwater systems, can dilute the isotope concentrations in groundwater samples; they must be accounted for to obtain accurate ages. These isotopes may also be useful in indirectly estimating bimodality in water sources. This could be an indication of dual permeability and fracture connectivity (Coplen 1999) (Cook 2000).
Fracture Aperture
A fracture is a planar feature in rock in which brittle deformation (separation or cracks) has occurred. A fracture generally forms in rock when external stresses exceed the strength of the rock. Fractures in clays can occur through desiccation and associated shrinkage. In low-permeable media, fractures dominate the flow system and can act as the primary contaminant transport pathways (NRC 1996). Individual fractures may constitute a significant groundwater flow pathway and contaminant conduit; however, fractures must be interconnected to form a continuous flow path to act as preferential flow zones. It is therefore important to determine which fractures act as continuous features and which are nontransmissive; this determination is usually made through hydraulic testing.
The aperture is the width of a fracture. The three main types of fracture aperture measurements are as follows:
- Mechanical aperture – The mechanical aperture is the actual measured fracture width, which can vary significantly throughout the fracture, and represents the true aperture distribution throughout the fracture. This aperture can change if the fracture is pressurized or depressurized. Hydromechanical well testing attempts to measure this change (Rutqvist et al. 1998; Schweisinger et al. 2009).
- Hydraulic aperture – Hydraulic apertures are the theoretical fracture widths calculated with the cubic law using transmissivity (T) values determined from hydraulic tests. Hydraulic apertures represent the size of the fracture based on the hydraulic behavior.
- Transport aperture – Solute transport apertures can also be determined based on the behavior of solute transport through the fracture.
Typically, these three types of apertures conflict, and there is still discussion about which apertures is most applicable for inputs into discrete fracture network models for contaminant transport.
Fracture Connectivity
Fracture connectivity in concert with the aperture and density of fractures determines the overall bulk hydraulic conductivity of the formation. Poorly connected fractures result in relatively low hydraulic conductivity. Conversely, well-connected fractures result in higher hydraulic conductivity.
Hydraulic Conductivity
Hydraulic conductivity (K) is related to the permeability of a porous medium, but it is specific to the moving fluid.
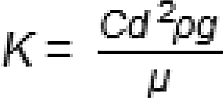
K can also be expressed as:
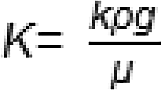
Where:
C is dimensionless shape factor that relates to the shape of the pore spaces.
d is the average diameter of the matrix grains.
ρg is the specific weight of the fluid.
μ is the viscosity of the fluid.
Cd2 is equal to k which is the permeability of the porous medium.
K is most often used to describe the movement of water and is often considered the proportionality constant (K) in Darcy’s Law; however, the conductivity of any liquid can be determined in this manner if the permeability of the porous medium and the properties of the fluid are known.
The transmissivity (T) of an aquifer is a measure of how much groundwater can be transmitted horizontally over a unit thickness of the saturated aquifer. It is expressed as:
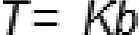
Where:
K is the hydraulic conductivity.
b is the saturated thickness of the aquifer.
K or T (transmissivity) values are commonly determined from hydraulic tests, and are important for developing a flow system model to assess the migration of contamination being carried by the moving water. The K value is the maximum velocity at which the fluid could flow through the given porous medium.
Velocity (v) is the rate groundwater flows through the aquifer proportional to the K and hydraulic gradient (Fetter 1994):
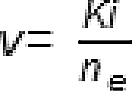
Where:
K is the hydraulic conductivity.
i is the hydraulic gradient.
ne is the effective porosity.
Although a unit may have high hydraulic conductivity and good permeability, contaminant migration may be limited if the hydraulic gradient at the site is small. However, human activity (such as water supply extraction or fluid injection) and natural phenomena such as tides and seasonal climate variations (such as spring snow melt, floods, or droughts) can significantly influence local gradients; for example, a drought can change what was a gaining stream into a losing stream and reverse the groundwater gradient.
Hydraulic Head
The hydraulic head is the sum of the elevation head, pressure head, and velocity head (Fetter 1994), although the velocity head is generally negligible in groundwater unless in karst terrains. In an open hole that is screened over an entire aquifer or an entire hydrogeologic unit, the water level in the open hole represents the total head in that unit and can be used to determine hydraulic gradients, the natural driving force for groundwater flow. However, if the hole penetrates more than one aquifer or hydrogeologic unit, the water level in the open hole is a blended head that results from the cross-connected units that have different heads and conductivities. This is especially important to understand in fractured rock systems or layered aquifers where head profiles with depth are instrumental in defining hydrogeologic units to improve accuracy in gradient calculations and for defining contaminant migration pathways.
Borehole Condition
During drilling of a borehole or corehole the bedrock matrix immediately adjacent to the borehole wall can deform slightly to severely with fracturing and breakouts representing the severe outcome. Clay swelling/expansion and destabilization of sensitive minerals in the adjacent matrix can be activated by exposure to the drilling process including drilling fluids. Coatings and fillings associated with intersected discontinuities may be washed away or concentrated. Depending on the type and approach taken in drilling and coring the borehole wall and intersecting open discontinuities can become coated with a layer of drilling mud/fluid or dislocated cuttings. Accelerated biological activity can cause plugging by biomass and/or inorganic mineral precipitation. The zone of finite thickness of altered (and typically undesirable) conditions that extends from the borehole wall into the matrix is referred to as the skin or damage zone. Certain borehole surveying tools including several geophysical logging tools are capable of returning useful information on the presence and extent of skin or damage zone. Caliper logs, video cameras, and geophysical sensors that can interrogate for changes in moisture content or porosity with radial distance. It is generally desirable to minimize skin or damage zone to optimize on groundwater extraction or injection, in-situ remedial actions involving injection of treatment agents, and to help ensure representativeness of fluid samples obtained from specific horizons.
The physical condition of a borehole – including its diameter; depth; structural integrity; degree of collapse; physical, chemical, or biological clogging or fouling; condition of installed structures such as well screens, sand packs, and seals – is often assessed upon installation to determine whether specifications have been met and to establish a baseline condition. It is then measured periodically for monitoring and maintenance or to troubleshoot a performance deficiency. Borehole condition is generally measured with a downhole camera.
In fractured rock boreholes, optical or acoustic televiewer logs can be used to create a virtual caliper log that can be very useful for identifying breakout zones where part of the rock has been dislodged from the wall, and to select good locations for setting inflatable packers to maximize the likelihood of creating a good seal.
Chemistry
Chemical data provide information on the site’s contaminants and geochemical conditions and contaminant distribution. Parameters include contaminant concentrations, system biogeochemistry (for example, microorganisms and total organic carbon), and water quality parameters (for example, oxidation reduction potential [ORP], pH, dissolved oxygen [DO], alkalinity, and temperature). These data types provide direct measurement of the chemical conditions in the subsurface. Most data analysis and interpretation methods rely on the chemistry of the groundwater; however, chemistry data are not limited to one type of media. Soil gas and porous media samples can be collected and analyzed to help complete or round out the picture of the source zone(s) in the CSM. The chemical composition of the geologic media may have a significant impact on contaminant fate (for example, carbon, alkali minerals) and how effective some remediation fluids may be under the ambient geochemistry conditions (for example, the abundance of ferric iron when a reductive dechlorination process is to be applied).
Chemistry data methods can be divided into three primary categories: quantitative, semiquantitative, and qualitative. Quantitative methods are usually defined as using formal laboratory analytical methods and equipment to compound specific values in units of concentration based on traceable standards (for example, μg/L, ppm, ppbv). Because of the high cost, the number of samples that can be analyzed may be very limited. Limiting the number of samples due to analytical costs has often resulted in CSMs that cannot provide the necessary resolution to understand contaminant distribution, degradation, and migration. Sometimes a well-equipped on-site mobile laboratory can provide the same or similar chemical data quality as a fixed lab at a reduced price. This will often provide for more samples and higher data density, giving better resolution of conditions for the CSM.
Semiquantitative (compound-specific quantitative measurements based on traceable standards but in units other than concentrations (for example, ng or µg) or provides measurements within a range) to qualitative (indirect measurement (for example LIF and PID measurements provide a relative measure of absence or presence, but are not suitable as stand-alone tools for making remedy decisions) methods often provide results in relative concentrations and may not provide analyte specificity. Several of the direct-push logging tools fall into this category (for example, MIP, LIF, OSTs). Although they do not specifically identify contaminants, these tools can provide valuable semiquantitative data on contaminant concentration, at the much higher resolution needed to understand their distribution and migration, so that an effective CSM can be developed.
Subsurface (Soil) Gas
Data on contaminants in the vapor phase in the vadose zone are an important component of many DNAPL CSMs. Soil gas measurements may indicate the presence of a contaminant source in the unsaturated zone or help to define the extent of groundwater contamination. Gas measurements are also used to assess potential or actual contaminant vapor intrusion into structures. The concentration of a volatile contaminant in the pore space in the vadose zone may also indicate the composition and concentration of these volatile contaminants in the adjacent shallow groundwater.
Contaminant Concentration
Volatile organic contaminants are present in the subsurface in dissolved form and non-aqueous phase form but also as a component of subsurface gas. If naturally occurring geologic/biogenic gases are present in separate-phase then the contaminant may partition into the gas bubble/phase in which contact occurs. Non-aqueous phase volatile organic contaminants and high concentrations of dissolved-phase volatile organics can volatile directly into the gas phase of the vadose zone. The concentration of contaminant in the subsurface gas is often reported in terms of mass per unit volume.
Groundwater
Groundwater chemistry is described in several distinct categories, including geochemistry, microbiology, field or indicator parameters, and contaminant measurements. However, the resolution of the measurement is always a function of the sample size. Many studies have shown that wells with long screens produce blended concentration values that can be orders of magnitude less than wells with multiple short screens at the same location. Multilevel monitoring systems are invaluable for measuring depth-discrete groundwater samples over time to fully understand the contaminant distribution in the groundwater.
Geochemistry
Geochemical parameters, often referred to as water quality parameters, include those that typically define the suitability of groundwater for consumption. Geochemical parameters include alkalinity, hardness, pH, DO, and minerals such as iron, magnesium, calcium. These parameters can inform an investigator of general groundwater conditions at a site, and can indicate groundwater contamination as well as assist with the evaluation of remedial alternative. During a site investigation, field parameters are often collected by low-flow purging of groundwater through a multiprobe sonde that typically measures pH, specific conductance, temperature, DO, ORP, and turbidity.
Microbial Community
Knowledge of the microbial community is important since some types of bacteria can degrade the contaminant of concern even in the unsaturated zone. However there must be moisture for a microbial community to survive. Several varieties are known to degrade contaminants and identification of them will help to assess the applicability of active degradation. In other cases, the degree of microbial diversity can be an indicator of the toxicity of an environment.
NAPL Presence
The presence of DNAPL represents a potentially persistent reservoir of contaminant mass that can continue to degrade groundwater quality over long periods. Therefore, understanding the potential presence and distribution of DNAPL in the subsurface is critical to long-term site environmental management. NAPL confirmation requires direct observation. However, there are a variety of chemical and physical techniques are available to provide evidence of the presence of NAPL (some of which provide direct evidence that NAPL is present), as follows:
- measurement of contaminant concentration in bulk soil samples (may provide direct evidence or an indication of NAPL presence)
- sorption techniques (such as NAPL FLUTe, which provides direct evidence of NAPL when it reacts with the coating on the FLUTe)
- tracers (such as Partitioning Interwell Tracer Test), which provide an indication of NAPL presence
- fluorescence (such as LIF), which provides direct evidence of NAPL
- dye (such as Sudan IV and Oil Red O), which provides direct evidence of NAPL
- optical (such as GeoVIS), which provides direct evidence of NAPL
- conductivity (such as NAPL interface probes), which provides direct evidence of NAPL)
See Chapter 2 and Chapter 3 for more thorough descriptions of NAPL and NAPL behavior in the subsurface.
Dissolved Contaminant Concentration
The contaminant concentration in the solid matrix of the aquifer can be used to indicate the presence of DNAPL or light nonaqueous phase liquid (LNAPL), via partitioning calculations (Feenstra, Mackay, and Cherry 1991; Mariner, Jin, and Jackson 1997), which can serve as an ongoing source of mass to the aquifer. This can be either mobile NAPL or immobile NAPL. High contaminant concentrations in the source area can indicate an early-stage release from an ongoing source of a DNAPL versus lower concentrations, which may be more indicative of a diffusive source from a middle- or late-stage release.
Because of the high cost of completing boreholes at contaminated fractured rock sites, analyzing samples from the rock core at adequate frequency is important for understanding the contaminant mass distribution in the rock, and is a major factor in designing a multilevel system for measuring groundwater that will be installed at a later date. In addition, because of open hole flow, a multilevel sampler may show groundwater contamination at locations where the rock core did not; therefore, rock core concentrations are necessary to fully understand the contaminant distribution measured in the groundwater.
At sites where volatile organic contaminants are present in unconsolidated formations, several direct-push logging methods can be used to qualitatively define contaminant concentrations and distribution. Some of these logging methods are LIF, MIP, and ROST. These logging methods can provide detailed information on contaminant distribution at a relatively low cost. The logs may be used to guide the targeted collection of expensive laboratory samples, thus optimizing the information gained while reducing overall costs.
Solid Media
Solid media consists of the subsurface material of unconsolidated or bedrock geologic terrains.
Composition Coatings/Cement/Binder (Geochemistry)
Chemical analysis of solid geologic material is important because contaminants can be sorbed or sequestered on fine grained or weathered particles. Many secondary minerals occur as very fine-grained rock particles or crystalline material that can sorb and desorb metals and organic constituents. This fine-grained material may be very transient in that they can precipitate and dissolve over short periods depending on the local environment. Chemical analyses of solid geologic material can delineate sinks for subsurface contaminants.
Fraction of Organic Carbon, Foc
Fraction of organic content, foc, is a measure of the fraction of organic carbon in the subsurface solid material. The higher the foc the more organic matter is available to adsorb contaminants. The higher the organic content of the soils, the more contaminant can be adsorbed and less is available to leach to groundwater. In transport models, foc is an important parameter because the organic carbon content of the soils in part determines the degree of retardation of a contaminant in groundwater. Physical test are required to identify foc (see Appendix I for more information regarding foc).
The ability of an organic chemical/contaminant to sorb to the aquifer matrix is a function of the foc of the aquifer and the affinity of the contaminant to the organic carbon. This is known as the organic carbon partitioning coefficient, which is represented as Koc.
NAPL Presence
The presence of NAPL represents a potentially persistent reservoir of contaminant mass that can continue to degrade groundwater quality over long time periods. Therefore understanding the potential presence and distribution of DNAPL in the subsurface is critical to long-term site environmental management. NAPL confirmation requires direct observation of NAPL; however, there are a variety of chemical and physical techniques available to confirm the presence of NAPL.
- measurement of contaminant concentration in bulk soil samples (may provide direct evidence or an indication of NAPL presence)
- sorption techniques (such as NAPL FLUTe, which provides direct evidence of NAPL when it reacts with the coating on the FLUTe)
- tracers (such as Partitioning Interwell Tracer Test), which provide an indication of NAPL presence
- fluorescence (such as LIF), which provides direct evidence of NAPL
- dye (such as Sudan IV and Oil Red O), which provides direct evidence of NAPL
- optical (such as GeoVIS), which provides direct evidence of NAPL
- conductivity (such as NAPL interface probes), which provides direct evidence of NAPL)
Sorbed Contaminant Concentration
Chemical analysis of solid geologic material is important because contaminants can be sorbed or sequestered on fine grained or weathered particles. Many secondary minerals occur as very fine-grained rock particles or crystalline material that can sorb and desorb metals and organic constituents. This fine-grained material may be very transient in that they can precipitate and dissolve over short periods depending on the local environment. Chemical analyses of solid geologic material can delineate sinks for subsurface contaminants.
Microbial Community
Knowledge of the microbial community from any solid material is important since some types of bacteria can degrade the contaminant of concern even in the unsaturated zone. However there must be moisture for a microbial community to survive. Several varieties are known to degrade contaminants and identification of them will help to assess the applicability of active degradation. In other cases, the degree of microbial diversity can be an indicator of the toxicity of an environment.